Strain Gauge Basics – Part 2 – Shunt Calibration
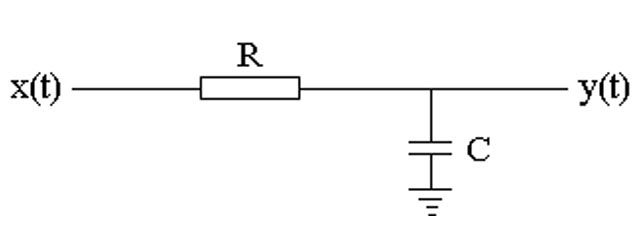
As mentioned in the previous post, in order to relate the measured voltage difference across the bridge circuit to a strain measurement, we need a way of calibrating the system. In most systems, including the Prosig acquisition systems, this is done by including a high-precision shunt resistor across one of the legs in the bridge. For example, the following diagram shows a quarter-bridge circuit with a shunt calibration resistor, RS, across the bridge completion resistor R2.