
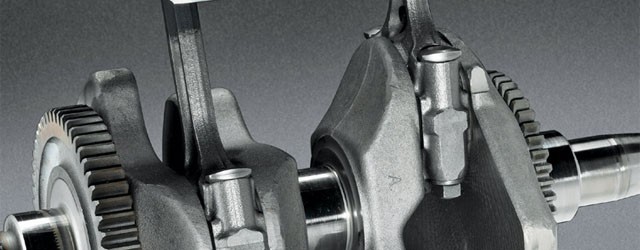
Using Prosig’s P8000 series data acquisition system with DATS signal analysis software, torsional analysis (crank shaft jitter) was performed on an automotive engine attached to an engine dynamometer. The significance of this is that only one tachometer channel was required to identify crank jitter.
Measuring Torsional Crank Shaft Jitter

In order to measure and analyse crank shaft jitter we first need to capture the necessary data.
The Prosig P8020 data acquisition unit (see figure 1) was used to capture the crank tachometer signal from a magnetic pickup transducer. Because the magnetic tachometer transducer increases in amplitude with speed, the DATS Acquisition Trigger Level function was set to a suitable level to accommodate for the characteristics associated with the magnetic pickup eliminating the need for extra signal conditioning.
Prosig’s DATS software was used to process the acquired magnetic pickup tachometer signal (60 tooth gear) using the Rotating Machinery Analysis module. The analysis was initially done with DATS graphical Worksheet processing method and then converted to a DATS Script for automated processing of many data runs.
The DATS worksheet shown in figure 2 is used to perform all of the torsional analysis discussed in this article.

DATS worksheets make it easy take advantage of all the powerful analysis functions available in the DATS software. Users or operators don’t need to know macro or scripting languages to achieve sophisticated analysis results.
Below are analysis sub-modules within the DATS Rotating Machinery Analysis module.

Within the Rotating Machinery sub-modules are an extensive list of analysis functions to choose from.
Waterfall Display

A traditional Waterfall display shows energy at frequency related to speed. The waterfall display is often an engineer’s first port of call when analyzing data from rotating parts. The reason for this is that the waterfall gives a good overview of the data and allows the engineer to quickly view the entire frequency spectrum and the complete speed range. Decisions can then be taken as to the best way to apply further analyses.
Intensity Plot

An Intensity plot clearly shows the energy at specific orders and at critical speed ranges. It uses the same data as the waterfall display, but displays it as a flat 2-D map with magnitudes represented by different colors (or intensities).
The intensity plot makes it easier to spot areas of greater magnitude, especially if viewed with log or dB magnitudes. It does, however, lose some of the relative magnitude information provided by the waterfall display.
Torsion Peak Hold Spectrum

Torsion Peak Hold Spectrum shows peak angular displacements over frequency range.
A tacho signal may be analyzed to provide the angular vibration velocity (degrees/sec) and by further integration the angular vibration displacement (degrees) as a function of time. The Torsional peak hold spectrum shows the peak frequency components of the angular displacement. Basically, it is the extraction of the maximum angular displacements at each frequency in the spectrum across successive time segments.
Torsion Angle Orders Spectrum

The Torsional Angle Orders spectrum shows the peak crank order components of the angular displacement at a particular rotation speed. The orders correspond to those frequencies which are multiples of the rotation speed, for example, if a shaft is rotating at V rpm then the nth order is at a frequency, f, given by f = n*(V/60) Hz.
Having worked which orders are contributing most (2.5 and 4) we can use the following analysis to see at what speed they are most prominent.
Torsion Angle Orders

The Torsion angle orders shows the extracted crank orders, including the overall level as a function of rotational speed. The highest energy is shown at around 4800 rpm. The main contributor at this speed is order 2.5. At around 1750 rpm the main contributor is the 4th order.
This brief overview of the capabilities of the Prosig P8000/DATS system for acquisition and analysis of the crank jitter from a single magnetic pickup tachometer gives some understanding of how rotating machinery such as engines, transmissions and gear boxes may be analyzed with emphasis of use of the DATS Rotating Machinery Analysis suite. Other DATS signal analysis modules were used in conjunction with the Rotating Machinery analyses such as Band Pass Filtering and Re-sampling.
Chris Mason
Latest posts by Chris Mason (see all)
- Rotating Machinery Vibration Analysis: Keeping Your Machines Humming Along - November 27, 2023
- Vibration Control and Isolation: A Comprehensive Guide for Engineers - November 6, 2023
- Modal Analysis in the Real World - October 6, 2023

I think its a really good explanation. I always find it tough to draw inferences from a waterfall plot. I request you to bring out some more case studies in this regard. Thanks