
This article will look at the basic steps needed to measure noise & vibration in rotating machines. We won’t look in great detail at some of the techniques involved – we deal with these elsewhere on the blog. This material is suitable for a newcomer to the field who understands the basic concepts of noise & vibration analysis but has not dealt with rotating machinery before.
Why do we need to measure noise & vibration in rotating machines?
The analysis of rotating machinery is central to refinement activities in the automotive and general industry. It also allows engineers to trace gearbox faults, transmission systems and bearings faults.
Every rotating part in a machine generates vibration, and hence noise, as a result of small imperfections in the balance or smoothness of the machine’s components. In addition, there are so-called “blade-passing” phenomena associated with blades of fans and pumps. In every case, we can relate the frequency of the vibration to the speed of the rotating machine. For example, a fan with five equally spaced blades will generate noise at five times the speed of rotation and sometimes at higher multiples still depending on the number of supports used to hold the fan in place. If these are close to the blades, then the frequency becomes the product of the number of blades and the number of supports.
These vibrations act as a forcing function on the structure of the machine or vehicle, where they are mounted. The most severe effects occur when the frequency of excitation generated by the rotating part matches one of the natural frequencies of the structure. These “coincidence” frequencies are often the target of much design effort to limit the effects, whether they be fatigue, vibration or resulting noise.
With variable speed machines, it is a considerable challenge to reduce noise and vibration to acceptable levels. The rotating components are often transmitting very large amounts of power and, unfortunately, even very small amounts of power, converted to vibration or noise, can produce undesirable effects.
Analysing Data From Rotating Machinery
Let’s assume we have captured a noise or vibration signal from some sort of rotating machine while it we accelerate it through it’s entire speed range. We will use a short noise signal recorded from a 4-cylinder race car engine. In figure 1 we can see the time history of the signal and you can use the link below to listen to the signal.

The simplest way to analyse the frequency content of this data would be to calculate the auto-spectrum. We see the result in Figure 2.

Advertisement
COMPLEXITY MADE SIMPLE
From sensors to DAQ to analysis & reporting, Prosig supports your entire measurement chain
Whether you need accelerometers from our colleagues at DJB Instruments, microphones, pressure sensors or something else, Prosig can supply them as part of your system. Or you can use your own. Discover more about the Prosig hardware and software range.
Because the engine we were testing was changing speed, it is almost impossible to draw any meaningful results from this spectrum. It is clear we need a different approach. Our first approach might be to segment the data into sections and look at a series of spectra generated from those segments. This is done with a “Hopping FFT”. This takes a fixed length section of the time history, performs an FFT and then moves along a small increment and repeats the process. This produces a series of FFT spectra spread across the whole time period of the test as seen in Figure 3.

Figure 3 is what most people visualise when they think of a waterfall plot. This data can be represented in many different ways. One of the most popular and useful is an intensity or colour plot as seen in Figure 4.

The plot shows frequency along the bottom axis and time runs from bottom to top. It is clear that the red lines seen on the left part of the map represent the rising frequencies as the engine accelerates over time. So these are the effects due to rotation that we are interested in. What we are still missing, though, is any information about the speed of the engine.
Analysing Speed Of Rotation
What we need to know is the speed of the engine across the time period of our test. There are several ways to obtain this, but the most accurate is to capture some sort of tacho signal. Ideally, a tacho signal should be a square wave or pulse. It can be anything from a once per revolution pulse measured from some moving part of the engine to several thousand pulses per revolution generated by an encoder. Figures 5 and 6 show our tacho signal at two different times in our test.
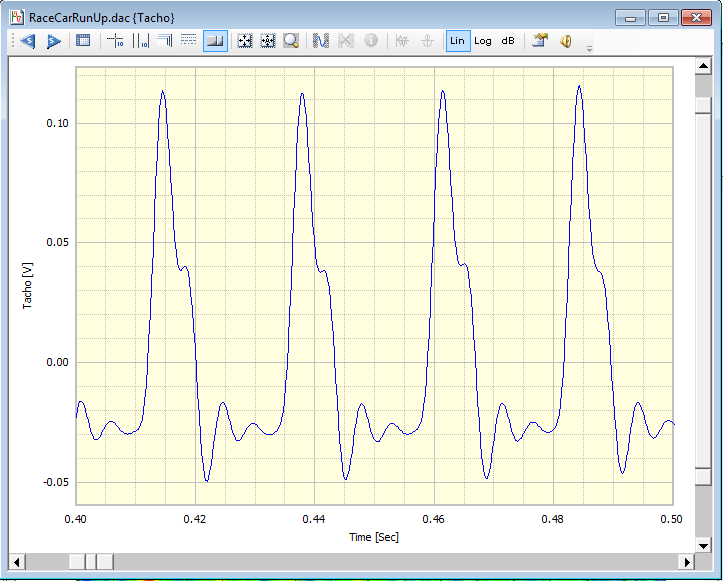
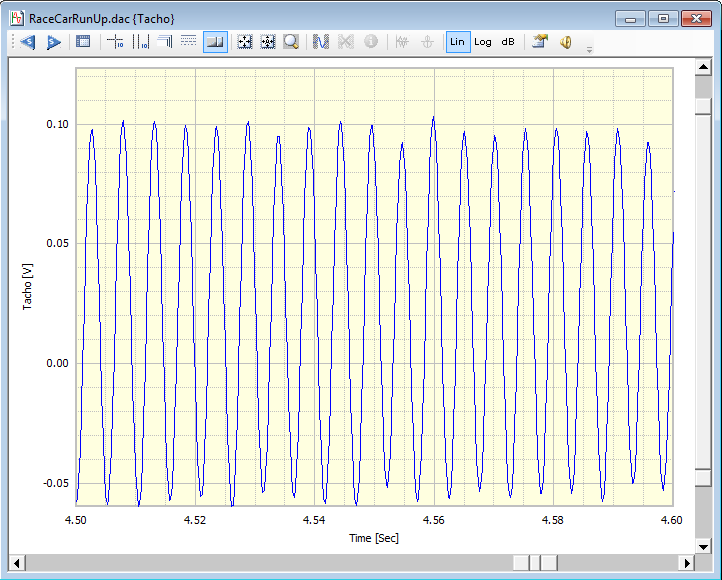
Our signal was generating two pulses per revolution. Both figures above show 0.1s of data so it is clear that in Figure 6 the engine was rotating significantly quicker than in Figure 5. It is plain that our signal is not a clean square wave, but so long as the tacho processing algorithm is sophisticated and robust enough this is not important. The tacho processing software analyses the entire tacho signal and produces another signal with represents speed over the time of the test. This can be seen in Figure 7.

Here we can see that, during our test the engine accelerated from just over 1000rpm to over 6000rpm in around 5.5 seconds.
Waterfall Plots
The next step in our processing is to perform our “Hopping FFT” processing again, but this time instead of calculating the FFTs at equally spaced time steps we calculate them at equally spaced speed steps using the information our speed v time data. This is what is known as “Waterfall” processing. The waterfall plot of our noise signal can be seen in Figure 8.
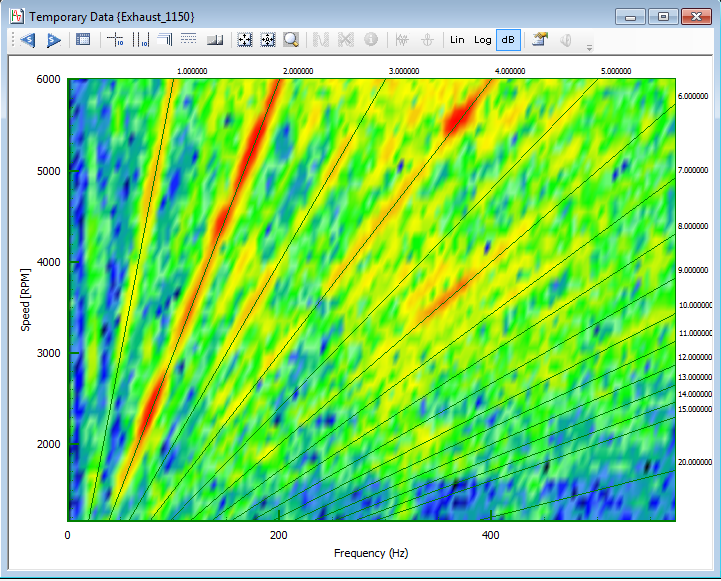
Now, we can clearly see the linear nature of the speed-related noise. This shows up as sloped lines in the waterfall plot. Because this is a four-cylinder, four-stroke engine, the dominant frequency is twice the speed of rotation or the second harmonic. In the case of rotating machinery, we call this second order.
Orders
Details of the orders can be extracted from the waterfall plot and an example from our data can be seen in Figure 9.

Figure 9 shows the 2nd, 4th and 6th orders overlaid with the overall level. The overall level represents the total energy at each speed.
Synchronously Sampled Data (The Order or Angle Domain)
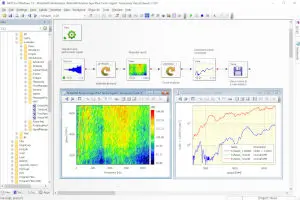
Once data has been captured along with a tacho signal, software such as Prosig’s DATS package can resample the data and convert it to the angle domain. This means that each data point represents equally spaced positions around a rotation cycle rather than equally spaced points in time. This enables easy analysis with a DFT to extract the orders directly, even if the speed varies dramatically during a cycle. Data synchronously sampled in this way can be averaged across cycles in the angle domain, thus eliminating the noise of signals from other sources unrelated to the rotation. Further details of these techniques are beyond the scope of this article and will be dealt with in a future post.
Further Reading
Do Missing Tacho Pulses Mean The End Of The Road For Your Test?
Measuring Torsional Twist & Vibration Along a Shaft or Through a Geartrain
Average Waterfalls Or Average Orders?
This is only a small sample of the articles related to rotating machinery that you will find on the blog. Look here for more – Rotating Machinery.
Video
You can see a video here of the techniques discussed above being demonstrated in the DATS software.
Chris Mason
Latest posts by Chris Mason (see all)
- Rotating Machinery Vibration Analysis: Keeping Your Machines Humming Along - November 27, 2023
- Vibration Control and Isolation: A Comprehensive Guide for Engineers - November 6, 2023
- Modal Analysis in the Real World - October 6, 2023

Greetings! Hope all fine.
Please send me information on this product.
I would like to receive pricing information.
Thank you for your cooperation.
Awaiting your reply.
Yours sincerely,
Eng Shukri
Hello Shukri,
My name is James Wren, I have contacted you directly by email to discuss your requirements.
Thank you for posting on our blog.
sir , I have got a project on crank noise analysis in Honda company (2 wheeler).I m a student and I have completed my internship at Honda so please suggest me regarding crank noise. why I analyz the crank noise?
how to measure the SNR of signal. I have bearing vibration signal of 2 hp motor taken at load varying from 0 to 3hp load using dyanmometer. I have no idea about the noise level present?
Hello everyone!
I’ve been using Prosig DATS for analyzing noise created by a steering pump manufactured by our company. Usually we look at the waterfall obtained by ramping up the speed of the pump at various load conditions. Presently we are trying to ramp up the pressure load given to the pump at constant speed and capture the noise. How can I plot the Rms value of pressure vs the dB values of the noise measured.
Regards
Shakeel Abdulla
Hello Shakeel
This is a rather involved question to answer here. I have forwarded your query to your local representative who should be able to assist you.
Thank you for your question.
Chris