Developing an Algorithm for Tick Detection

An investigation was made of a sample of automotive components where some were exhibiting a high frequency “tick” or rattle during each operating cycle. This feature could be heard above the normal operating noise. The problem this posed was to measure and analyze components in an objective fashion and classify components as “good” or “bad”.

(more…)

Continue ReadingDeveloping an Algorithm for Tick Detection

Removing A-Weighting From Time History Signals

It sometimes occurs that signals are captured with A-weighting applied to the data by the acquisition device. This can be a problem if, for example, you wish to use the data in a hearing test or to use it for a structural vibration analysis. Now, A-weighting allegedly mimics what the ear does to a signal. If we play back an A weighted sound then we perceive a double A-weighted signal which is clearly not intended. When doing structural work it is usually the lower frequencies, say 2kHz or less, that is generally required. A-weighting seriously attenuates the low frequencies and also applies gain above 1kHz.

(more…)

Continue ReadingRemoving A-Weighting From Time History Signals

Prosig Announce New Braking Analysis Tools

  • Post author:
  • Reading time:4 mins read
  • Post comments:2 Comments
  • Post category:news

Prosig are pleased to announce the launch of two new tools to assist engineers in the measurement and analysis of noise and vibration issues in braking systems.

Controlling noise and vibration from brakes is crucial to subjective customer satisfaction and problems of this type are one of the biggest contributors to warranty costs. Therefore, it is important to be able to accurately and quickly measure and analyze the various phenomena that can cause problems. In addition to all the standard NVH & Refinement tools that Prosig provide, there are now two specific products to address the needs of braking engineers.

(more…)

Continue ReadingProsig Announce New Braking Analysis Tools

Aliasing, Orders and Wagon Wheels

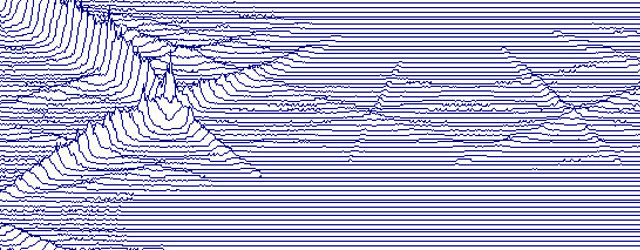
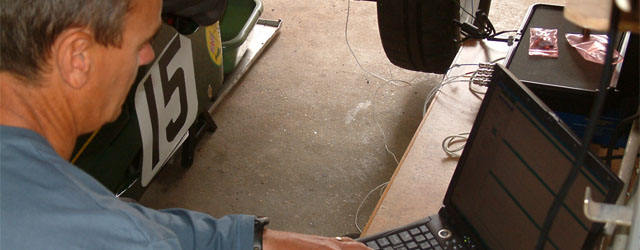
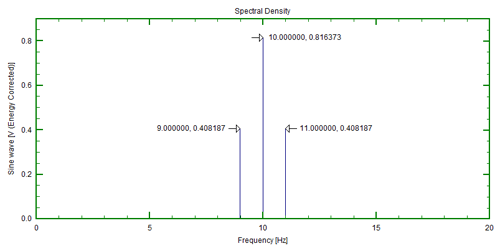
These days most people collecting engineering and scientific data digitally have heard of and know of the implications of the sample rate and the highest observable frequency in order to avoid aliasing. For those people who are perhaps unfamiliar with the phenomenon of aliasing then an Appendix is included below which illustrates the phenomenon.

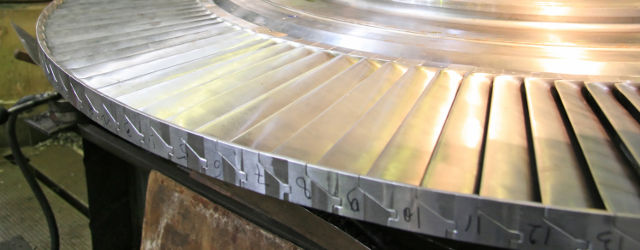
In saying that most people are aware of the relationship concerning sample rate and aliasing this generally means they are aware of it when dealing with constant time step sampling where digital values are measured at equal increments of time. There is far less familiarity with the relevant relationship when dealing with orders, where an order is a multiple of the rotational rate of the shaft. For example second order is a rate that is exactly twice the current rotational speed of the shaft. What we are considering here then is the relationship between the rate at which we collect data from a rotating shaft and the highest order to avoid aliasing.

The relationship depends on how we do our sampling as we could sample at constant time steps (equi-time step sampling), or at equal angles spaced around the shaft (equi-angular or synchronous sampling). We will consider both of these but first let us recall the relationship for regular equi-time step sampling and the highest frequency permissible to avoid aliasing. This is often known as Shannons Theorem [Learn more about Claude E Shannon].

(more…)

Continue ReadingAliasing, Orders and Wagon Wheels

Comparison Between Sound Intensity Probes and Acoustic Cameras

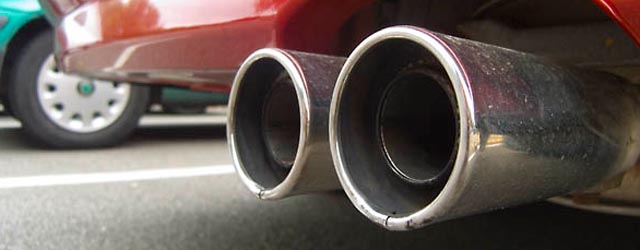
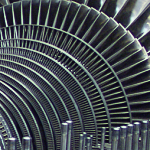
Sometimes we are asked about the differences between an acoustic camera and a sound intensity probe and which of the two is better for a particular application. There is no straightforward answer as they are quite different pieces of equipment, used for measuring different things. An acoustic camera is a tool used to locate and analyse sound sources, usually both steadystate and dynamic phenomena. The intensity probe is used to find the sound intensity at a particular position, usually a steadystate phenomena.

(more…)

Continue ReadingComparison Between Sound Intensity Probes and Acoustic Cameras
Read more about the article A Simple Frequency Response Function
Figure 5: H1(f)

A Simple Frequency Response Function

The following article will attempt to explain the basic theory of the frequency response function (FRF). This basic theory will then be used to calculate the frequency response function between two points on a structure using an accelerometer to measure the response and a force gauge hammer to measure the excitation.

Fundamentally a FRF is a mathematical representation of the relationship between the input and the output of a system.

(more…)

Continue ReadingA Simple Frequency Response Function
Read more about the article Amplitude And Energy Correction – A Brief Summary
Figure 4: Energy corrected spectrum

Amplitude And Energy Correction – A Brief Summary

Amplitude and energy correction has been and is a continuing point of confusion for many people calculating spectra from time domain signals using Fourier transform methods. The first thing to say, the information contained in data presented as amplitude and energy corrected spectra is equivalent. The only difference is the scaling of the numbers calculated.

(more…)

Continue ReadingAmplitude And Energy Correction – A Brief Summary

Data Windows : What, why and when?

Before we discuss the use of data windows, we should first remind ourselves of three basic properties of the FFT (Fast Fourier Transform) process.

  • First, energy information in signal must be preserved during transformation. That is, the energy measured on time signal must equal the energy measured on the frequency representation of that signal.
  • Second, an FFT converts the signal representation between time and frequency domains. The time domain representation shows when something happens and the frequency domain representation shows how often something happens.
  • And finally, an FFT assumes that the signal is repetitive and continuous.

(more…)

Continue ReadingData Windows : What, why and when?

How To Analyze & Measure Torsional Vibration

Torsional Vibration Measurement
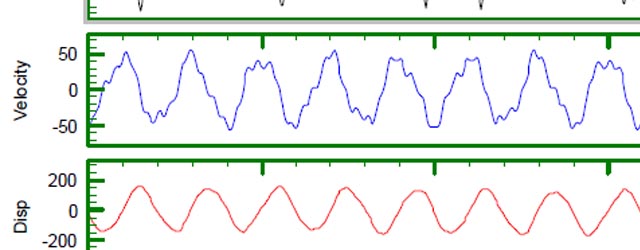
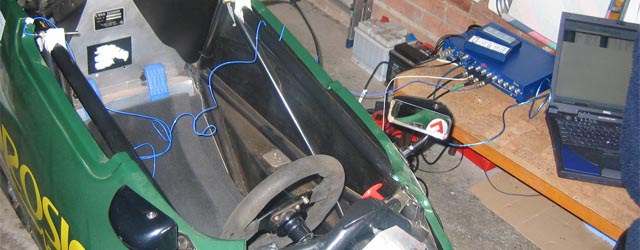
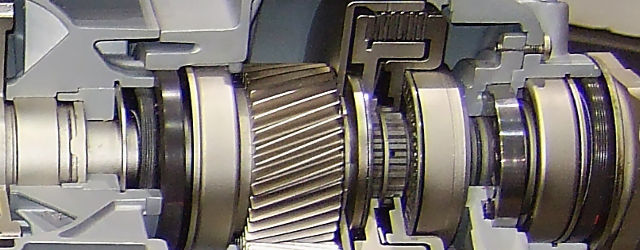
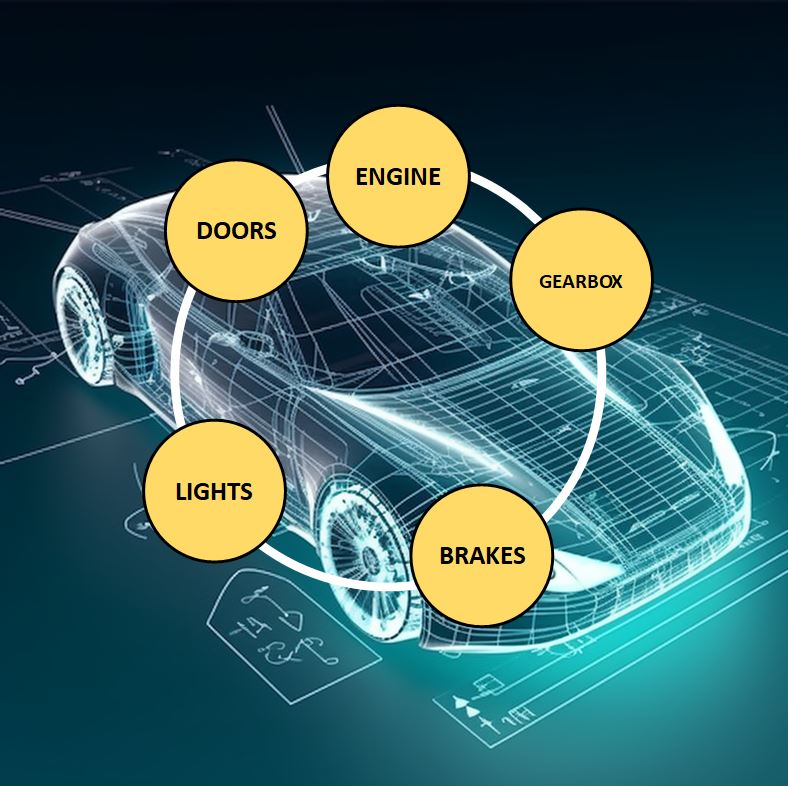
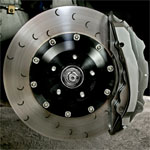
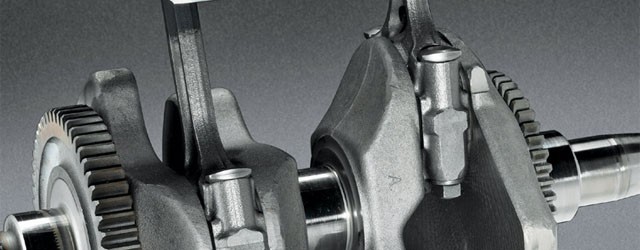
Knowing how to measure torsional vibration is of key importance in the area of vehicle development and refinement. The main contributory source is the engine where periodically occurring combustion cycles cause variation in the crankshaft rotary vibration. This vibration is transmitted to and modified further by other components in the powertrain such as the gearbox and by other equipment driven off the drive belt or chain. Additional torsional vibrations are also likely to appear downstream at the drive shafts and wheels.

(more…)

Continue ReadingHow To Analyze & Measure Torsional Vibration

Orders v Time – Comparing Overall Levels

By combining a speed signal with a data signal and using the Short Time FFT algorithm (Hopping FFT), it is possible to extract order data directly as a function of time (Orders from Hopping FFT) rather than as a function of speed (Waterfall). This is very useful when analyzing a complete operational cycle which includes run ups, rundowns and periods at operational speeds.

(more…)

Continue ReadingOrders v Time – Comparing Overall Levels

Measuring Torsional Crank Shaft Jitter

Using Prosig’s P8000 series data acquisition system with DATS signal analysis software, torsional analysis (crank shaft jitter) was performed on an automotive engine attached to an engine dynamometer. The significance of this is that only one tachometer channel was required to identify crank jitter.

(more…)

Continue ReadingMeasuring Torsional Crank Shaft Jitter

What Is Resonance?

We hear the word used a lot, but what is resonance? First, in order to explain we have to explain the terms we will use.

  • A period is the amount of time it takes to complete one cycle
  • The number of cycles in one second is the frequency of an oscillation.
  • Frequency is measured in Hertz, named after the 19th-century German physicist Heinrich Rudolf Hertz
  • One Hertz is equal to one cycle per second.

(more…)

Continue ReadingWhat Is Resonance?

Order Cuts And Overall Level

Order cuts are taken from a set of FFTs, each one at a different rpm. The rms level is then found as the Square root of the Sum of the squares of each of the FFT values. Mathematically, if x_{ks} is the modulus (magnitude) of the k^{th} value of the FFT at speed s for k = 1,\dots,N-1 then the rms value at that speed is given by

rms_s = \sqrt{\sum_{k=0}^{N-1}{x_{ks} ^2}}

This takes into account the entire energy at that speed both the order and the non order components, including any noise.

(more…)

Continue ReadingOrder Cuts And Overall Level

Acceleration, Velocity & Displacement Spectra – Omega Arithmetic

Accelerometers are robust, simple to use and readily available transducers. Measuring velocity and displacement directly is not simple. In a laboratory test rig we could use one of the modern potentiometer or LVDT transducers to measure absolute displacement directly as static reference points are available. But on a moving vehicle this is not possible.

Continue ReadingAcceleration, Velocity & Displacement Spectra – Omega Arithmetic

Measuring For Success With A Hammer Impact Test

The following application note shows the steps taken to perform structural analysis using a hammer impact test on an automotive exhaust pipe structure to improve the structural damping properties of the exhaust pipe mount. This application note follows up to a previous article – “Preventing Component Failure In The Fast Lane”.

A recent signal processing application note described how the Prosig sponsored Dalmeny Racing Formula Ford Team, whilst contesting the UK Formula Ford 1600cc championship, suffered several minor structural failures on a particular part of an exhaust pipe mount. Prosig dispatched a team of engineers, and after a brief survey of the damage, the engineers made an outline assessment. They concluded that “the exhaust itself is resonating at particular engine speeds. This is causing some shear forces in the mount. This in turn is causing stresses in the material leading to cracking and eventually failure.”

(more…)

Continue ReadingMeasuring For Success With A Hammer Impact Test

Measuring Exhaust Noise Using A P8000 System

The following note describes measuring exhaust noise using a Prosig P8000/DATS system for the refinement of an automotive muffler design for a major after-market exhaust manufacturer in Europe. The particular vehicle under test was required by local legislation to have an overall radiated noise level of less than 70 dB. When tested, the vehicle was found to be producing 71.8 dB of radiated noise. The design of the exhaust system clearly needed to be reviewed and modified. (more…)

Continue ReadingMeasuring Exhaust Noise Using A P8000 System

Torsional Vibration, Tacho Pulses And Aliasing

With shafts, gears and the like, the general method of determining the rotational speed is to use some form of tachometer or shaft encoder. These give out a pulse at regular angular intervals. It we have N pulses per rev then obviously we have a pulse every (360/N) degrees. Determining the speed is nominally very simple: just measure the time between successive pulses. If this period is Tk seconds and the angle travelled is (360/ N) degrees then the rotational speed is simply estimated by 360/(N*Tk) degrees/second or 60/(N*Tk) rpm.

(more…)

Continue ReadingTorsional Vibration, Tacho Pulses And Aliasing

A Simple Automotive Noise Test

In a recent article we described how the Prosig P8000 hardware and DATS software had been used to help Dalmeny Racing diagnose a problem with an exhaust bracket on their Formula Ford racing car. Whilst the car was instrumented for structural tests on the exhaust the opportunity was taken to carry out a simple automotive noise test. It was felt that these would provide some useful “real world” data as well as maybe providing some extra information regarding the exhaust bracket failure. After analysing and animating the hammer data it became clear that the engine runup data wouldn’t be needed. However, it was decided that some analysis should be carried out to see if the noise and vibration data backed up the conclusions of the other tests.

(more…)

Continue ReadingA Simple Automotive Noise Test

Spectrum Smoothing : Why and How?

Sometimes data has spikes which are clearly artefacts of the processing or are due to some other external source. One is used to seeing these on time series but in some cases there are unrepresentative “spikes” in the frequency analysed data. Here we discuss how we can use spectrum smoothing to alleviate the problem. An example spectrum is shown below.

(more…)

Continue ReadingSpectrum Smoothing : Why and How?

Measuring Torsional Twist & Vibration Along a Shaft or Through a Geartrain

The measurement of torsional twist, or the twist angle, between two points along a shaft or through a gear train may be derived from a pair of tacho signals, one at each end of the shaft. Typically the tacho signals would be derived from gear teeth giving a known number of pulses/revolution. For example one end of a shaft could have a gear wheel with say 60 teeth giving 60 pulses/revolutions when measured with say an inductive or eddy current probe. (more…)

Continue ReadingMeasuring Torsional Twist & Vibration Along a Shaft or Through a Geartrain