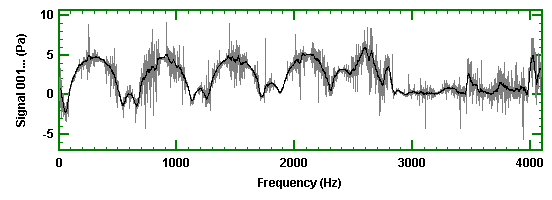
Sometimes data has spikes which are clearly artefacts of the processing or are due to some other external source. One is used to seeing these on time series but in some cases there are unrepresentative “spikes” in the frequency analysed data. Here we discuss how we can use spectrum smoothing to alleviate the problem. An example spectrum is shown below.

There are clearly several spikes which at first sight could be mistaken for very narrow band resonant responses. Looking at the spectrum on a dB scale (or a log scale) shows the expected underlying spectral structure. This is basically a series of “bumps”.

The objective is to obtain a better visualisation of this underlying structure. One could acquire more data to reduce the scatter and indeed this should be done in the present case as there was a very low number of statistical degrees of freedom. However as is sometimes the case the opportunity to take more data was not available and we have to make do with what we have! The underlying trend is obvious in the graph shown in Figure 2. However if we just trend the original signal the ‘spikes’ will cause a problem. We can however use a simple device. First take the loge (using Math Function) of the data. The result is shown below and this is clearly identical in form to that shown in Figure 2.

Now we do the Mean Trend (Trend Functions) and in this case an integration length of 25 points was used. The resultant trend (Black) is then shown below overlaid on the loge data (Grey). It is clear that the trend line follows the principle structure.

To get back to the original plane we now just use the exponential function (Maths Functions). This gives the result shown below. There is still some degree of spikeness but it is much reduced and we have a much clearer indication of the underlying nature.

Dr Colin Mercer
Latest posts by Dr Colin Mercer (see all)
- Data Smoothing : RC Filtering And Exponential Averaging - January 30, 2024
- Measure Vibration – Should we use Acceleration, Velocity or Displacement? - July 4, 2023
- Is That Tone Significant? – The Prominence Ratio - September 18, 2013


Thanks for the article! Had to understand what spectral smoothing was for a paper I had to read in class.
Helpful !