

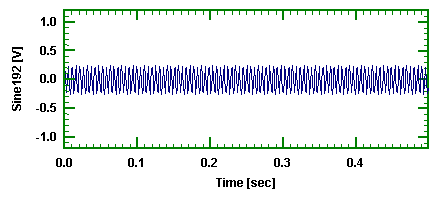
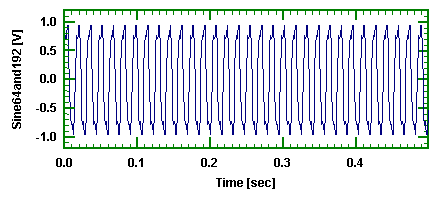
A Fourier Transform takes a signal and represents it either as a series of cosines (real part) and sines (imaginary part) or as a cosine with phase (modulus and phase form). As an illustration, we will look at Fourier analysing the sum of the two sine waves shown below. The resultant summed signal is shown in the third graph.

If we now carry out a Fourier Transform, in this case with an FFT (Fast Fourier Transform), of the combined signal then we obtain the following result.

We see immediately that there are two distinct peaks in the modulus curve and two distinct changes in the phase curve at 64Hz and at 192Hz as expected.
The amplitude shown is exactly half of the original constituent sine waves. That is the sine wave of unity amplitude at 64Hz is shown as 0.5 and the sine wave of amplitude 0.25 is shown as 0.125. Why is this? The reason is that when we do a frequency analysis of a signal some of the ‘energy’ is represented for positive frequencies and a half for the negative frequencies. For a real-time signal, as opposed to a complex time signal, then this energy is split equally and we get exactly half. Some software packages do a doubling to overcome this but this is not done in DATS. This is to make so-called half range analysis compatible with full range analyses.
| Sine Wave Amplitude | Peak to Peak Value | FFT or DFT Value |
| A | 2A | A/2 |
Table 1. Amplitude Relationship
Now consider the phase part. The original 64Hz sine had a zero degree phase and the 192Hz had a 30° phase. From the phase plot at 64Hz the phase jumps from 0° to -90°. Why? This is because Fourier analysis uses cosines and sines. It is cosines, not the sines, which are the basic reference. Hence as a sine wave is a -90° phase-shifted cosine then that is what we get. The phase shift at 192Hz was not 30° but -60°. This is totally correct as we have (-90+30) = -60°. More explanation of this is given in the slightly more mathematical part at the end of these notes.
In the above examples, the signals were represented by 512 points at 1024 samples/second. That is we had 0.5 seconds of data. Hence when we using an FFT to carry out the Fourier analysis then the separation between frequency points is 2Hz. This is a fundamental relationship. If the length of the data frequency analysed is T seconds then the frequency spacing is (1/T)Hz.
Selecting the FFT size, N, will dictate the effective duration of the signal being analysed. If we were to choose an FFT size of say 256 points with a 1024 points/second sample rate then we would use 1/4 seconds of data and the frequency spacing would be 4Hz.
As we are dealing with the engineering analysis of signals measuring physical events it is clearly more sensible to ensure we can set our frequency spacing rather than the arbitrary choice of some FFT size that is not physically related to the problem at hand. That is DATS uses the natural default of physically meaningful quantities. However, it is necessary to note that some people have become accustomed to specifying “block size”. To accommodate this DATS includes an FFT module shown as FFT (Select) on the frequency analysis pull-down menu. This module does allow a choice of block size.
“Non Exact” Frequencies
In the above examples, the frequency of the sine waves were exact multiples of the frequency spacing. They were specifically chosen that way. As noted earlier 0.5 seconds of data give a frequency spacing of exactly 2Hz. Now, suppose we have a sine wave like the original 64Hz sine wave but at a frequency of 63Hz. This frequency is not an exact multiple of the frequency spacing. What happens? Visually it is very difficult to see any difference in the time domain but there is a distinct difference in the Fourier results. The graph below shows an expanded version of the result of an FFT of unit amplitude, zero phase, 63Hz sine wave.

Note that there is not a single spike but rather a ‘spike’ with the top cut off. The values at 62Hz and 64Hz are almost identical, but they are not 0.5, rather they are approximately 0.32. Furthermore, the phase at 62Hz is 0° and at 64Hz it is 180° . That is the Fourier analysis is telling us we have a signal composed of multiple sine waves, the two principle ones being at 62 and 64Hz with half amplitudes of 0.32 and a phase of 0° and 180° respectively. In reality, we know we had a sine wave at 63Hz.
If we overlay the modulus results at 63Hz and 64Hz then we note that the 63Hz curve is quite different in character to the 64Hz curve.

This shows that care needs to be taken when interpreting FFT results of analysing sine waves as the value shown will depend upon the relationship between the actual frequency of the signal and the “measurement” frequencies. Although the amplitudes vary significantly between these two cases if one compares the RMS value by using Spectrum RMS over Frequency Range then the 64Hz signal gives 0.707107 and the 63Hz signal gives 0.704936.
The above results were obtained using an FFT algorithm. With the FFT the frequency spacing is a function of the signal length. Now given the speed of the modern PC then we may also use an original Direct Fourier Transform method. In particular, the DFT (Basic Mod Phase) version in Frequency Analysis (Advanced) allows a choice of start frequency, end frequency and frequency spacing. The DFT is much slower than the FFT. Choosing to analyse from 40Hz to 80Hz in 0.1Hz steps gives the results shown below with the continuous curve. The * marks are those points from the corresponding FFT analysis.

This now shows the main lobe of the response. The peak value is 0.5 at 63Hz and the phase is -90° . Also from 62Hz to 64Hz the phase goes from 0° to -180° . Note that this amount of phase change from one “Exact” frequency to the adjacent one is typical.
The above plot shows all the “side lobes” and illustrates another aspect of digital signal processing, namely the phenomenon known as spectral leakage. That is in principle the energy at one frequency “leaks” to every other frequency. This leakage may be reduced by a suitable choice of data window. The shape of the curve in Figure 7 is actually that of the so-called “spectral window” through which we are looking at the data. It is often better to think of this as the shape of the effective analysis filter. In this example, the data window used is a Bartlet (rectangular) type. Details of different data windows and their corresponding spectral window are discussed in a separate article.
In this note, we have been careful to use “frequency spacing” rather than “frequency resolution”. It is clear that with DFT and other techniques we can change the frequency spacing. For an FFT method, the spacing is related to the “block size”. But what is the frequency resolution? This is a large subject but we will give the essence. The clue is the shape of the spectral window as illustrated in Figure 7. A working definition of frequency resolution is the ability to separate two close frequency responses. Another common definition is the half power (-3dB) points of the spectral window. In practice, the most useful definition is a frequency bandwidth known as the Equivalent Noise Band Width (ENBW). This is very similar to the half power points definition. ENBW is determined entirely by the shape of the data window used and the duration of the data used in the FFT processing.
Signal Duration Effects
If we have data taken over a longer period then the frequency spacing will be narrower. In many cases, this will assist the problem but if there is no exact match the same phenomenon will arise.
Fourier analysis tells us the amplitude and phase of that set of cosines which have the same duration as the original signal. Suppose now we take a signal which again is composed of unit amplitude 64Hz sine wave and a 0.25 amplitude 192Hz sine wave signals but this time the 64Hz signal occupies the first half and the 192Hz signal occupies the second half. That is we now have a one second signal as shown below.

The result of an FFT of these two joined signals is shown below.

There are as expected significant frequencies at 64Hz and 192Hz. However, the half amplitudes are now 0.25 (instead of 0.5) and 0.0625 (instead of 0.125). One interpretation of what the FFT is telling us is that there is a cosine wave at 64Hz of half amplitude 0.25 for the whole one-second duration and another one of half amplitude 0.0625 for the whole duration. But we know that we had a half amplitude signal of 0.5 for the first part of the time and one with half amplitude of 0.125 for the second part. What is happening?
A closer look at the spectrum around 64Hz as shown below reveals that we have a large number of frequencies around 64Hz. This time they are 1Hz apart as we had one second of data. Their relative amplitudes and phases combine to double the amplitude at 64Hz over the first part and to cancel during the second part. The same of course happens in reverse around those frequencies close to 192Hz.

Another example is where a signal is extended by zeroes. Again the amplitude is reduced. In this case, the reduction is proportional to the percentage extension by zeroes.
The important point to note is that the Fourier analysis assumes that the sines and cosines last for the entire duration.
Swept Sine Signal
With a swept sine signal, theoretically, each frequency only lasts for an instant in time. A swept sine signal sweeping from 10Hz to 100Hz is shown below.


This has 512 points at 1024 samples/second. Thus the sweep rate was 180Hz/second. The FFT of that signal shows an amplitude of about 0.075. Over the duration of the sweep the phase goes from around zero to -2000° and then settles to -180° above 100Hz. If the sweep rate is lowered to around 10Hz/second then the amplitude becomes about 0.019. The relationship between the spectrum level the amplitude and sweep rate of the original swept sine is not straightforward.
It is clear that one has to interpret a simple Fourier Transform, whether it is done by an FFT or by a DFT, with some care. A Fourier analysis shows the (half) amplitudes and phases of the constituent cosine waves that exist for the whole duration of that part of the signal that has been analysed. Although we have not discussed it, a Fourier analysed signal is invertible. That is if we have the Fourier analysis over the entire frequency range from zero to half sample rate then we may do an inverse Fourier transform to get back to the time signal. One point that arises from this is that if the signal being analysed has some random noise in it, then so does the Fourier transformed signal. Fourier analysis by itself does nothing to remove or minimise the effects of noise. Thus simple Fourier analysis is not suitable for random data, but it is for signals such as transients and complicated or simple periodic signals such as those generated by an engine running at a constant speed.
We have not considered Auto Spectral Density (also sometimes called Power Spectral Density) or RMS Spectrum Level Analyses here. They are discussed in another article. However, for completeness, it is worth noting that the essential difference between ASD analysis and FFT analysis is that ASDs are describing the distribution in frequency of the ‘power’ in the signal whilst Fourier analysis is determining (half) amplitudes and phases. While ASDs and RMS Spectrum Level analyses do reduce the effects of any randomness, Fourier analysis does not. Where confusion occurs is that both analysis methods may use FFT algorithms. This is not to do with the objective of the analysis or its properties but rather with the efficiency of implementation. After all every analysis will use addition. That is just a mathematical operation and so, in that sense, is the use of an FFT.
A Little Mathematics
We will not go into all the mathematical niceties except to see that a Fourier series could be written in the forms below. In real and imaginary terms we have

and in modulus and phase form as

The above forms are a slightly unusual way of expressing the Fourier expansion. For instance 


However, the point of using
This means that with a DFT we can actually evaluate the Fourier coefficients at any frequency provided we obey the anti-aliasing (Nyquist) criterion. The DFT is slower than an FFT. Another way of getting at the finer detail and still getting some speed advantage is to use the so-called Zoom FFT based on the Chirp-z transform. Again the relative advantages are discussed elsewhere.
Dr Colin Mercer
Latest posts by Dr Colin Mercer (see all)
- Data Smoothing : RC Filtering And Exponential Averaging - January 30, 2024
- Measure Vibration – Should we use Acceleration, Velocity or Displacement? - July 4, 2023
- Is That Tone Significant? – The Prominence Ratio - September 18, 2013


Hello Dr Colin Mercer,
Thanks for your papers, they helped me a lot.
I’m a beginner in NVH area, and I am going to work mainly on vehicle NVH test.
I had some difficulties when reading your articles because of my lack of background knowledge.
Could you please send me some basic knowledge materials?
Thanks a lot!
dear sir;
how can earn orginal signal amplitude from fft cofficient.
would you send me some informaton about this relation.
best regard
Hi Benjamin
Where to begin? NVH is a wide subject in itself. One could be involved with a gearbox whine, with a rattle somewhere, a shaft out of balance causing some vibration, a structural resonance or one of the large number of sound quality measures (loudness, sharpness, …). The basic common starting point however is that we nearly always consider these matters on a frequency basis. That is you need to be comfortable with the concept of transforming the time signal into the corresponding frequency signal by using a Fourier transform. The actual mechanics of the Fourier transform are not intrinsically important in the understanding of NVH, but the limitations and assumptions are very important. So I have just gathered together a few notes below about interpretation.
1. Frequency and time are inversely proportional. Thus if we have a signal of length T seconds then the raw frequency resolution is (1/T)Hz.
2. Fourier Transforms may be inverse transformed back from frequency to time. This means that we have no extra information, way just have a different representation which we may understand better. It also means that if we have a time signal that has some random data in it then the Fourier Transformed signal also has some random element in the Fourier coefficients. This usually means we have to average the Fourier transformed data, not directly but as a modulus squared. This leads us to spectral densities and spectrum levels.
3. The act of Fourier transforming a finite length of the time signal causes leakage of information into adjacent frequencies. This brings us into the domain of data windows that are designed to minimise these effects. Whilst minimising the leakage of information from one frequency to others, using a data window means that the frequency resolution is made larger. If in doubt use a Hanning window.
4. Frequency resolution is not the same as Frequency separations (or steps). That is we may form estimates of the Fourier coefficients at frequency steps of say df Hz but the frequency resolution may be dF Hz, where dF > df .
5. When we use a finite length of data and Fourier analyse it then each coefficient is an ‘average’ over the resolution dF. We may liken the Fourier transform to passing the time signal through a series of narrow band filters each of width dF Hz but spaced df Hz apart, that is the filters overlap each other.
Hope these help, there is no magic bullet – just a lot of work, time and effort trying to understand.
Colin
Hi Mehdi
the very last equation in 1-6 above article shows how the original signal may be reconstituted from the Found coefficients. In a crude sense if the real and imaginary components at frequency f are ak and bk respectively then the modulus of the “equivalent” cosine wave at frequency f is sqrt(ak*ak + bk*bk). In a crude sense this is the “amplitude” at frequency f.
But beware with real life signals only use this as a simple model to aid understanding.
Colin
Dr. Mercer,
I’m curious about the significance of the frequency (or range thereof) which the phase jump occurs. I have transients (not sinusoidal) showing a lot of phase jumps and I am trying to interpret what these frequencies mean.
Thanks,
James.
James,
There are multiple reasons for a phase jump. First of course we ignore those phase jumps that occur when one plots phase on say a 0 to 360 degree plot (or -180 to 180 or similar) that are “wrapping” around. Actually I often plot on the phase unwrap basis to get an overall idea.
The classical reason for a phase “jump” is that one is passing thpartrough a resonance in that frequency range. This should be accompanied by an increase in the amplitude. If you have truncated your transient then the sharp stop will cause some phase changes as the Fourier transform has to fit this really rapid amplitude change. Such a change way be small in amplitude but could be quite significant in phase change.
Now the phase at each frequency is determined by the inverse tangent of the imaginary part of the Fourier component at that frequency divided by the corresponding real part. For reference the real front is the cosine coefficient and the imaginary part is the sine coefficient. If over some frequency region the real and imaginary parts are small and are fluctuating around zero then because we use their ratio in finding the phase then clearly the phase will also fluctuate wildly. Basically then if the amplitude, which is the square root of the sum of the real part squared and the imaginary part squared, is small then the phase is not reliable in a real system where we have ‘noise’ present. In deed if it is only the real part that is small and is fluctuating do to noise, then one can have large phase changes.
It is away useful if in doubt to look at the real and imaginary parts. Also try looking at a vector plot of Real versus Imaginary as this can be most instructive.
Colin
hi it is nice can u give me more on z fourier analysis ,i am working on DSP.with this email . sht_admsu@yahoo.com
i am instructor in KOFORIDUA POLYTECHNIC GHANA WILL LIKE YOU TO E-MAIL ME WITH PROJECT DESIGN ON THE AREAS OF APPLICATION ON DSP
What a wonderful presentation.
Very elaborate, clear and articulate.
You really deserve the very best.
Abiye Zerfu
Dear Dr.Colin Mercer:
I am a graduate student, and i am working on bridge cable vibration analysis. I use accelerometer to capture acceleration data on specify location on cable. I need to convert acceleration to displacement. I was using double integration, but its hard to tell the reliability of my results. I am interesting in your post about Fourier Analysis, but my background in digital processing is very low at the moment. Since my signal data contain different modes of frequencies. How can I apply Fourier Transform if I just want the first mode data and convert acceleration time histroy to displacement time history?? My email is huanglehuangle@gmail.com. If you could send me a reply in email i will send you one set of my experimental data and explain what I really want. BTW, thanks for information provided above, its very fresh information to me.
Hi
The Fourier Transform handles all frequencies simultaneously. In a simple way you can think of it as a large number of parallel filters all working at the same time. If you have the Fourier transformed result in modulus & phase form then multiply the modulus by omega squared and negate the phase. You now have the displacement spectrum.
Why restrict to first mode? Do you know its frequency?
I’ve tried doing some FFT’s to get average data but have been confounded by the fact that there’s many FFT commands in DATS and when I’ve tried there’s been question asked by the commands that I could not answer. Can you give the specific commands that you’ve used for your examples and if possible give me a solution for mine (My data reapeats at 3 frequencies and I want to get the average height at which the data repeats… Seems like and FFT would do that but I can’t get the right command)
Marco
You are correct that the Fourier Transform will return the average peak amplitude of each of the frequency components. Remember that the Fourier Transform is speed over positive find negative frequencies. So if, as usual, we only look at the positive frequencies then the amplitude calculated by DATS will be half the amplitude. That is if the Fourier analysis shows say 0.4 then the amplitude in terms of an equivalent sinewave is 0.8.
In the examples I used the DATS Moph command. This computes values in terms of modulus and phase (this in the same as some people call amplitude and phase).
Generally within DATS if you use the default values for parameters you will get a sensible result. The Moph command asks three questions, all to do with how the phase is calculated. The first question asks about phase limits : zero to 2PI (0 to 360 degrees); +/-PI (-180 to +180 degrees); or phase unwrap. The phase unwrap mode, which I normally use, detects each time the phase crosses the 0 to 2PI (0 to 360 degree) boundary and either adds en subtracts 2PI (360 deg) appropriately. The second question is do you wish to see the phase in radians or degrees, with degrees as the default.
The third question is more technical and if you are unsure use the default of 80dB, as I do 99% of the time. What this question is about is handling the situation when the individual real and imaginary are small as the phase at each frequency comes from arctan(imaginary/real). Now with acquired data if there is no meaningful energy at a frequency then both the real and the imaginary parts will be small and basically act like random noise. This causes the phase to jump around like no tomorrow. Setting the value to zero will turn it off, but generally making it smaller than 80 will make it more severe (less phase noise).
Dear Dr.Collin,
My question is very similar to question by Le Huang’s on july 2010.I am also currently struggling converting acceleration data to displacement and finding frequency of the bridge.The measurement is taken on steel bridge.
I tried to plot it using the accelerometer it self and also using Mathlab which both showed me fourier transform is taken place.But I couldn’t read a distinct or dominant frequency on the plot.
Do I need to filter it first.is so how?
Thank you in advance.
Regards,
Richel
Richel,
First my apologies for not replying earlier, but it got lost from my action list over Christmas until I was reminded by our moderator!
You do not in principle need to filter first but there are situations where one dominant energy will “cover up” others. The most problematical region is that caused by the dc or ‘zero Hz’ component. Usually this is caused by imperfections in the acquisition systems, specifically the amplifiers. This is not a design fault in the equipment but a basic fact of the way amplifiers work.
If your Fourier result has a very large dc component then you may have a “challenge” – I prefer challenges to problems!. There are multiple possibilities. The first is that you should eliminate the dc, which is the mean value, of each segment you intend to FFT before you do the FFT by calculating the mean value of the segment and then subtracting that value from each value in the time history segment. This is a sort of perfect filter as it only removes the zero Hz component. You may of course find you still have an apparently large zero Hz component. That probably means you do not have enough frequency resolution. That is the length of data you are doing the FFT on is too short. Just think of it physically; it is essential to get a few cycles of response at the lowest frequency in order to find anything near reliable about what is happening at that frequency. So If your bridge has a resonance at say 0.2 Hz then each cycle takes 5 seconds. I would like to see around 10 cycles or so, so my FFT needs to be quite long especially as people sometimes digitise at a much too high a rate because they can! But your signal is probably a transient so you need a very good acquisition system with genuine dynamic range. Just having “24 bit adc’s” is not a guarantee as they are not the weakest part of the acquisition system theses days, rather it is the true dynamic range and that is a whole separate topic made very difficult by confusing terminology and differing definition of what is true dynamic range. Adding zeroes or just repeating the last value artificially is not the answer. By doing so you are adding a discontinuity whose high frequencies may well alias back to anywhere in your data and no amount of digital filtering can remove it. There is no substitute for acquiring good long sections of data with reputable equipment – and keep the analogue parts physically well away from the computer or laptop. From a signal analyst view computers are horrible noise inducing and dc offset generators that corrupt my precious analogue signals, but when I have the signals digitised they are my best friend!
If you do not have a large dc offset or if it disappeared after removing the mean value, then it may mean your measurement devices are ac coupled – all IEPE ones are ac coupled – and just do not measure your frequency. No real solution except to measure with more suitable equipment, and there are strain guage based accels that go down to dc.
Dr Colin,
First of all thank you for such an elaborative answer. It is still not late. I was also away for holiday.
Would there be an article published specifically for converting acceleration data to frequency domain data? Please send me if so for proper referencing.
I still have a difficulty in identifying the dominant (fundamental) frequency from the simple acceleration vs time data. May be I am missing an important concept there.
1. What is the fundamental purpose of FFT on the acceleration data?
2. My instrument is a simple USB accelerometer that measures acceleration in three directions and no amplifier needed. The acceleration and time data is directly measured without any additional transducer or amplifier. It even plot PSD using the inbuilt programme written in java which unfortunately didn’t give me noticeable (peak) frequency out of the data. So how do we obtain the frequency of the structure from the acceleration response data?
Hoping to hear from you.
Kind Regards,
Richel
When you measure a vibration signal you have information as a function of time, let us call it x(t). When we Fourier transform the same information is translated into the frequency domain, say X(f). The frequency domain information tells us the average amplitudes of the ‘equivalent’ cosine waves existing over the whole measurement period. So suppose you measure for 100 seconds. If you have an excitation for just 1 second then the amplitudes indicated by the FFT will in general terms be around (1/100)th of the actual levels. Bit more complicated than this as the response is usually longer than the excitation so not so much loss as indicated.
If we measure for 100 seconds and this is OK with the available FFT size then your frequency resolution will be (1/100)Hz, if you FFT a 1 second signal it is only 1Hz resolution.
So first questions are how are you exciting the bridge, how long are you recording the data, what sample rate are you using, and what FFT size is being used.
Another possibility is that your software is showing you the spectrum on a dB scale. This ‘flattens’ the response. You need a linear amplitude FFT scale for vibration work.
You are measuring with a USB powered accel. These actually use a MEMS accel chip (MEMS = Microelectromechanical systems). Now these are aimed for the most part for low frequency, especially dc, operations. There are several manufacturers of the basic chip but each type gives a different frequency range, and each has a different frequency range. For example Analog Devices ADXL210A goes up to around 16Hz, Motorola M1220D up to 90Hz, and Endevco 7290A-10 up to 1600Hz.
If your device uses the Anolog Devices type then if your frequencies are higher than say 25Hz you are unlikely to see them.
So a lot of questions to resolve.
Colin
Thanks Dr.colin,
It is clear what FFT does to the acceleration data. I managed to plot the frequency domain using mathlab. So my problem with plotting frequency domain solved.
My USB accelerometer measures up to 400Hz sample rate. I did my field measurements at 100Hz which I thought will be one of the reasons for not reading any peak in the frequency. I also thought may be the way I fixed my instruments had impact on the measured result. So I did calibration in the lab with industrial accelerometer which can measure up to 1024Hz and with my USB accelerometer which is fixed with wax, screw and double sided tape at 400Hz sample rate. The result is more or less the same for the USB.I observe though more peaks in acceleration vs. time plot in the USB than the industrial accelerometer. The frequency domain plot gives me the same amplitude but shifted frequency values.
So in general how do I differentiate which sample rate give the correct frequency value?
Thanks again.
Richel
hi…
can you explain about Vibration versus Displacement analysis in a engine vibration?
Raja
What you are asking is a very basic question. It is not clear to me what you actually mean by ‘Vibration versus Displacement’ analysis. In general Vibration is like Noise where Noise is the unwanted part of a sound. So in that sense vibration is often the unwanted effect of the operation of a system, not always true of course as sometimes we have devices such as a shaker that is specifically designed to create a known vibration. The result of a vibration is some motion. We may measure this vibration as a displacement, a velocity or as an acceleration. With appropriate mathematics we may convert any one of these to another. See for example the articles below:
https://blog.prosig.com/2006/12/07/acceleration-velocity-displacement-spectra-%e2%80%93-omega-arithmetic/
https://blog.prosig.com/2007/10/05/calculating-velocity-or-displacement-from-acceleration-time-histories/
https://blog.prosig.com/2010/12/16/methods-of-conversion-between-acceleration-velocity-and-displacement/
Possibly by displacement analysis you may mean the time domain, and by vibration analysis you may mean frequency analysis.
Most times the simplest transducer is an accelerometer. Some accelerometers do not measure down to dc (0Hz), so we do not know the very low frequencies. Most large displacements occur at low frequencies and the displacement at each frequency is related to the acceleration at that frequency divided by the square of the frequency. Thus getting displacement accurately at very low frequencies is a challenge.
Colin
Rahel,
USB accelerometer vs industrial accelerometer. You essentially have two queries:
(1) why are measured frequencies different;
(2) why are there more frequencies shown in analysis of USB accel than from industrial accel.
Dealing with different measured frequencies then something somewhere is not telling you the truth! The most likely cause is that the sample rate you think one of them was using is not the sample rate actually used. I presume you acquired the industrial accelerometer using a conventional data acquisition system from a reputable supplier, and if this is the case it is most probably the USB ‘specification’ that is giving you misleading information. If it is a sample rate problem then the frequency differences get progressively further apart as the frequency increases. If the sample rate is actually greater than the one stated then the signals will be at a higher frequency than expected.
The second situation is probably that the conventional data acquisition system has anti aliasing filtering, but the USB unit does not have any. So any signals above 200Hz (or whatever it really is) will be aliased back into the spectrum. See
https://blog.prosig.com/2010/06/29/aliasing-orders-and-wagon-wheels/
for more details.
Colin
Hi Dr. Colin,
I am learning from each of your post and thank you for that. Well initially my first problem using the USB accelerometer was that I could not see any distinct frequency from the acceleration data. However fixing both type of accelerometers (USB (400Hz sample rate) and Industrial (1024 sample rate) to rotary machine and supplying it with the same data gave me similar picks but with different magnitude. Therefore my questions are:
a. To what extent should I expect the frequency to vary between different sample rates?
b. What does it mean if I am not seeing the frequency peak at 400Hz in actual field while I see something in the lab(Though the scenario is different)?
c. I expect to see the frequency of structure for the first few modes that is up to 20Hz.Wouldn’t it be sufficient to use the 100Hz sample rate leave alone the 400Hz?
d. I am not sure about the industrial accelerometer whether it does filtering but I know the USB doesn’t .Therefore do you advise me to filter the data from USB? If so how?
Thank you for your time Dr.
Regards,
Rahel
A. Frequency Variations: In the sort of work you are doing frequency variations do not occur. In general frequency variations would be related to changes in either mass or stiffness or both, and to a smaller extent on damping. Remember also you are only seeing the analysis at a given frequency spacing which is inversely proportional to the actual time length of the segment on which you did an FFT. So if you sampled at 400 samples per second and your FFT size was 1024 points then the time of the segment is (1024/400) seconds, and the frequency spacing is (400/1024). The actual frequency resolution then depends on which data window you used. You may have significant non zero amplitude in two adjacent frequency locations. The actual maximum amplitude occurs approximately at a frequency between the two highest adjacent calculated amplitudes in proportion to those amplitudes.
If you are getting frequency variations between the two measurement systems then the likelihood is that one of them is not exact in its sample rate.
B. frequency peak at 400Hz Do not think you mean this! But in case you do you cannot analyse a signal with significant frequency content above half the sample rate. All above half sample rate will be aliased. Once digitised there is no feasible way of just eliminating aliased data. If you have significant energy above the half sample rate then all bets are off.
C. Which sample rate? As your data is not anti alias filtered then use the higher rate as it minimises the problem.
D. Anti Alias Filter Analogue data must be antialias filtered before it is digitised. So no hope with your USB device. But If you can prove there is no measurable energy above the half sample rate, and this would include noise from other frequencies, such as mains interference, then you could be ok. You may not like the answer that antialiasing must be done prior to digitising but it is there, rather a nuisance really but it will not go away. If for instance your mains frequency is at 60Hz then it will appear at 40Hz when you digitise at 100 samples per second, likewise second order would be at 20HZ and third order would also appear at 20Hz
Colin
Hi Dr. Colin,
Hope you are having a blessed good Friday and Easter holiday.Thank you for dedicating time to answer my questions
a) Frequency variation(problem solved):e
I agree with you completely that frequency should vary mainly due to stiffness and mass of structure (as f=(k/m)^0.5.No99% of frequency peaks almost coincides except I see more additional peak which is not there in the USB data.
The error was not a technical problem at all. The math lab script I wrote to plot acceleration vs time was plotting acceleration vs. number of data the whole time and like you mentioned previously I was supposed to change the length of signal to match the signal on my math lab script.
b) Frequency peak:
I definitely did not meant to say 400Hz frequency reading. I meant frequency reading from the USB with 400Hz sample rate
c) I am still new to the word aliasing.But I aready used the higher sample rate.
d) For the last response:
How do I prove there is no measurable energy above half sample rate. My expectation is as my calculation and Finite element modelling result with a maximum of 20-30Hz.Can I call this a prove?
Regards,
Rahel
Glad to see you are making progress. Only item I need to comment on is (d) about proving no significant data above the half sample rate frequency, which incidentally is often called the Nyquist frequency.
Well the only assured way is an analogue low pass filter. You may mathematically model your structure and expect that there will be no significant energy above the Nyquist frequency but there might be other sources. There might be some transient spikes, someone might be running an engine, you might have a fixing slip causing a step function, your forcing function might not be what you think it is, and so on. If you get some strange effects always look at the time history.
It is actually not only real higher frequency sources that create a problem. Suppose for example your system has a slow linear trend, this could be caused by some capacitive or inductive coupling, or poor earthing, or by using a single ended input rather than a differential input, or a whole set of other situations. What you then have is the true data effectively multiplied by a triangular function. Such a triangle has frequencies at multiples of the basic period and these will have been aliased by the mere fact of digitising.
What ever you do always look at the time histories for anomalies.
Colin
Dr. Mercer –
Thank you for sharing your knowledge here – I have a question relating to the output of an FFT calculation of acceleration data. I am measuring the acceleration of a sample using an attached piezoelectric stack actuator that is swept 1-5000 Hz over 2 seconds. The acceleration data is the FFT processed to find resonant frequencies. As I change the properties of the sample, the peaks change in magnitude and in frequency (i.e. shift left/right). My question: What are the units of the ouput from the FFT calculation? I understand I must correct for the window type and window size. As I have read, the output should be divided by the window size. Your article reconciles the 0.5 magnitude because of the symmetry of the frequency when including the negative frequencies as the original signal was of magnitude 1, because a square window was used. Does this mean the FFT output should be the same magnitude (and units?) of the input signal? Meaning, if I calculate the FFT from acceleration in m/s^2, should I get m/s^2 back?
I am finding many sources that say “correction of the FFT signal is necessary” or “accounting for the window type is required” but none say how, why or what the result is.
Thank you in advance for putting this to bed!
Mark
Mark
Remember the Fourier transform, which includes the FFT, is reversible. So if you have an input signal with units of m/s2 then that is the units of the FFT.
Now how do do we correct for the data window when we may not really know what the software has actually done in detail? The answer actually lies in the reversibility property. First we cannot check by inverse transforming as any ‘correction factor’ might be, shall we say, a ‘feature’ in the inverse code. Because the FFT is reversible it means that the “energy” in the time domain is the same as that in the frequency domain – this is known as Parsevals Theorem. So we can compute the dynamic rms squared value in the time domain very simply as it is the same as the standard deviation squared (when squared it is called the Variance in statistics). Note I have used the term dynamic rms as I have assumed the dc (zero Hz) value has been excluded. If it has not the you need the mean square. In time domain we have (1/N)* Sum(x squared) and in frequency domain we have Sum(Modulus squared) = Sum(Real squared + Imaginary Squared). Note it is a strict Summation, not an integration.
Beware also there are various definitions when doing Fourier Transforms of where the division by 1/T (= 1/N) occurs. Sometimes it is applied to the time domain, sometimes to the frequency domain, and sometimes 1/(sqrt(N) is applied to both sides. I always use it on the time domain side as then the zero Hz value equals the dc value which is of course the mean value.
Also beware you may get exactly half or double the expected value if your FFT is a half range (zero to half sample rate) and has been left at the correct half amplitude (gives half value), or has artificially doubled (gives twice value). The proper transform is a so called full range transform from -sample rate/2 to +sample rate/2.
What if any correction has been made for the data window will come out in the wash
Whilst your output FFT changes frequency and amplitude as you expected please remember the amplitude you get is related to your excitation. So to give a definitive value for your system ‘gain’ at a resonance you need to get the transfer function. If there is no noise then if X(f) is the fft of your excitation and Y(f) is the fft of your response then the transfer function H(f) is given by H(f) = Y(f)/X(f). If there is some noise present then you need to compute the cross spectrum Gyx(f) where x is the reference, and the auto spectrum Gxx(f). H(f) is then given by H(f) = Gxy(f)/Gxx(f) – actually there are several variants here but in general excitation signals are less noisy than response signals so usually the definition given works OK.
You need to be careful which software you use and the way it calculates things. And always test with a known signal before you try the real thing.
A Taylor series is an infinite series of the form
f(x) =
where ao, a1, a2, … are constants, called the coefficients of the series. A Taylor series does not include terms with negative powers. A Fourier series is an infinite series expansion in terms of trigonometric functions
1 Introduction
f(x) = ao + (2.1-1)
Any piecewise smooth function defined on a finite interval has a Fourier series expansion.
Periodic Functions
A function satisfying the identity f(x) = f(x + T) for all x, where T > 0, is called periodic or T-periodic as shown in Figure 2.1-1.
Figure 2.1-1 A T-periodic function.
For a T-periodic functionas prof dr mircea orasanu
f(x) = f(x + T) = f(x + 2T) = f(x + 3T) = … = f(x + nT)
If T is a
Hi Loiosu,
Thank you for posting on our blog, did your post have an objective at all?
also the same aspects we see as say prof dr mircea orasanu and prof horia orasanu as the followings
FOURIER PROBLEM
Author Mircea Orasanu
ABSTRACT
For a function with period , a continuous Fourier series can be expressed as [1-5]
(1)
The unknown Fourier coefficients and can be computed as
1 INTRODUCTION
(2)
Thus, can be interpreted as the “average” function value between the period interval .
(3)
(hence is an “even” function)
(4)
(hence is an “odd” function)
Derivation of formulas for and
Integrating both sides of Equation 1 with respect to time, one gets
(5)
The second and third terms on the right hand side of the above equations are both zeros, due to the result stated in Equation (1) of Chapter 11.01.
Thus,
(6)
Hence,
(7)
Now, if both sides of Equation (1) are multiplied by and then integrated with respect to time, one obtains
(8)
Due to Equations (1) and (3) of Chapter 11.01, the first and second terms on the right hand side (RHS) of Equation (8) are zero.
Due to Equation (4) of Chapter 11.01, the third RHS term of Equation (8) is also zero, with the exception when , which will become (by referring to Equation (2) of Chapter 11.01)
(9)
Thus,
Similar derivation can be used to obtain , as shown in Equation (3)
Using the continuous Fourier series to approximate the following periodic function ( seconds) shown in Figure 1.Complex Form of the Fourier Series
Using Euler’s identity, and the sine and cosine can be expressed in the exponential form as
since (10)
since (11)
Thus, the Fourier series (expressed in Equation 1) can be converted into the following form
(12)
or
or, since one obtains
(13)
Define the following constants
(14)
(15)
Hence:
(16)
Using the even and odd properties shown in Equations (3) and (4) respectively, Equation (16) becomes
(17)
Substituting Equations (14), (15), (17) into Equation (13), one gets
(18)
The coefficient can be computed, by substituting Equations (3) and (4) into Equation (15) to obtain
(19)
Substituting Equations (10, 11) into the above equation, one gets
(20)
Thus, Equations (18) and (20) are the equivalent complex version of Equations (1)-(4).
The unknown Fourier coefficients and can be computed based on Equations (2–4); as following:
Any periodic function such as the one shown in Figure 1 can be represented by the Fourier series as
where and have already been computed (for );
and
Thus, for one obtains
For one obtains
For one obtains
Plots for and are shown in Figure 2.
The “integration by part” formula can be utilized to compute the first integral on the right-hand-side of the above equation.
References
[1] E.Oran Brigham, The Fast Fourier Transform, Prentice-Hall, Inc. (1974).
[2] S.C. Chapra, and R.P. Canale, Numerical Methods for Engineers, 4th Edition, Mc-Graw Hill (2002).
[3] W.H . Press, B.P. Flannery, S.A. Tenkolsky, and W.T. Vetterling, Numerical Recipies, Cambridge University Press (1989), Chapter 12.
[4] M.T. Heath, Scientific Computing, Mc-Graw Hill (1997).
[5] H. Joseph Weaver, Applications of Discrete and Continuous Fourier Analysis, John Wiley & Sons, Inc. (1983).
Hi merniu – Unfortunately, you cannot post formulae and figures in the comments. Maybe you have a link to the paper?