The RMS of a time history is a measure of the signal’s overall energy and is often used when extracting features from a signal for prognosis and trending of vibration data.
For a time history which has been digitised at a particular sample rate SR samples/second for a total of N samples, the RMS of the digitised signal, x(i), can be estimated by:
Sometimes we may be presented with, or have only saved, an FFT spectrum of a signal and wish to obtain the RMS of the original time series. Alternatively we may have performed some frequency domain analysis on a signal and wish to see the effect on the RMS energy. One example might be, integrating and acceleration signal to velocity in the frequency domain, and we wish to calculate the overall RMS energy of the resultant velocity signal.
Advertisement
Some examples of the products from the CMTG brands
DJB Accelerometers
Sense

- Piezoelectric charge & IEPE accelerometers
- Instrumentation, cables & accessories
- Calibration & repair service

Prosig DATS Hardware
Capture

- Rugged, mobile data capture
- Options inc. 24-bits @ 300k samples/sec
- From 4 to 1000’s channels

Prosig DATS Software
Analyze

- Don’t just test – gain insight from your data
- Huge selection of signal processing algorithms
- Optional application add-ons

One important feature of the FFT, as defined by Parseval’s thorem, is that total energy of the signal is preserved. Parseval’s theorem states that the sum (or integral) of the square of a function is equal to the sum (or integral) of the square of its Fourier transform.
When performing an FFT of a time history {x(t)} the frequency spectra X(f) is generated. A full FFT extends in the frequency domain from 0 to the Sample Rate, SR. In general, for a real signal, this FFT spectrum will be conjugate symmetric which means that the second half of the spectrum is a mirror image of the first half centred around the Nyquist frequency, SR/2. When considering the energy within an FFT spectrum then we can estimate that half the total energy is contained within the half-range transform from 0 to SR/2.
Therefore, assuming we have a half-range FFT of a signal we can estimate the RMS of the original signal using Parseval’s theorem by:
Where is the modulus of the complex components of the FFT at each spectral line.
This means that if we sum the squares of each component within a half-range FFT, multiply by 2 and form the square root we can obtain an estimate of the RMS of the original time history.
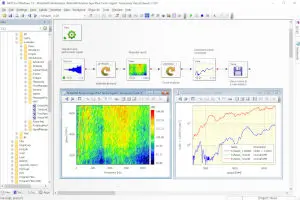
The following example uses Prosig’s DATS software to provide a simple proof of Parseval’s theorem.
1. Generate a triangle wave, of amplitude ±2V, 512 samples, sampling rate 1600 samples per second at 50Hz.
The RMS of this signal is expected to be . In practice the RMS of this generated digital signal, is calculated within DATS as 1.1592 (using the function Time domain Analysis: Statistics).
2. If we now calculate the half-range FFT of this signal and compute the modulus component we can see the frequency spectrum from 0 to SR/2 = 800Hz.
3. To calculate the RMS from this half-range modulus spectrum we can perform the following steps within DATS.
- Extract the Modulus component ( Complex Functions: Extract Modulus)
- Square the signal (Maths function: Raise to power 2.0)
- Calculate the Sum of the components (Maths function: Sum)
- Multiply by 2.0 (Arithmetic function: Signal * Constant)
- Form the Square Root (Maths function: Square Root).
The RMS of the signal, as derived from the FFT is then yielded by reading the value of the final point in the calculated signal:
Here we see that the calculated RMS value from the FFT spectrum is 1.1592 which agrees with the RMS calculation from the generated signal, hence proving Parseval’s theorem.
Don Davies
Latest posts by Don Davies (see all)
- Strain Gauge Basics – Part 2 – Shunt Calibration - February 26, 2024
- Bearing & Gearbox Vibration Analysis Using Demodulation Techniques (Part 1) - February 23, 2024
- Strain Gauge Basics – Part 1 - February 9, 2024


I don’t think you understand what a proof is. You validated it though…
Nice explanation. Just a small comment: please do not forget to mention that the FFT modulus is already normalized for the formula for the frequency spectrum to be valid (not every body is familiar with FFT calculations and some time it can be confusing).
Math Work has very poor documentation on this. Few things I am still having issues. – First you multiply your PSD by factor of 2.00 to take into account the effect of Nyquist Frequency. – Secondly if we use Hann window, we need to multiply by 1.5 (ENBW – Equivalent Noise Band Width) to accommodate the amplitude error OR multiply by 2.0 to accommodate the amplitude error ( see the figure) – Do we need to multiply 1.63 energy correction factor when calculating RMS ? Have I understood this correctly
Nice article!
I made some tests and the rms spectrum calculation showed here works when there is no window applied in the signal….is that okay to calculate rms from the spectrum not applying window in this case? Leakage won’t matter here?
What if I have Hanning window applied in the signal before the FFT calculation? Is there any correction factor to calculate the rms from the spectrum in this case?