When recently dealing with some vibration data from a runup of a pump, we observed some strange phenomena in the results.It turned out to be a classic case of amplitude modulation.
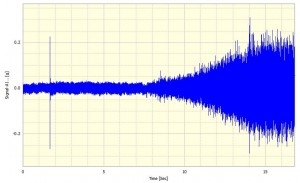
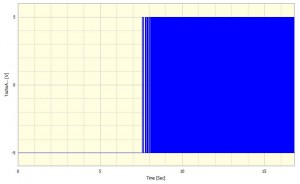
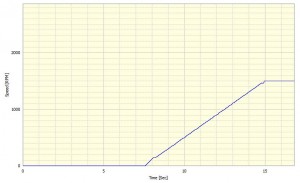
As shown in Figure 1 the original data looks a fairly standard run up time series. Figure 2 shows an associated tachometer signal and Figure 3 shows the speed curve calculated from the tachometer signal.
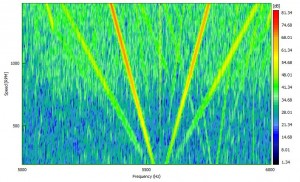
Waterfall analysis of the data, as shown in Figure 4, shows a number of interesting frequency components.
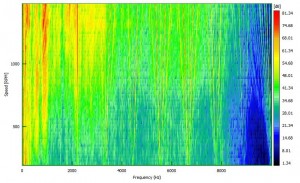
This shows a sharp central frequency with wider outer peaks. The presence of the outer peaks both above and below the central frequency suggests ‘side-bands’. The presence of side bands around a central frequency is a well-known phenomenon which we discussed further in – Bearing & Gearbox Vibration Analysis using Demodulation Techniques? (Part 1)
Figure 5 focuses on one particular frequency component in detail. The central, resonant frequency can be seen, with the side bands, and their harmonics, moving away from the central frequency on both the left and right-hand sides of the spectrum.
Sidebands are usually caused by amplitude modulation of a central carrier frequency. If the carrier frequency is A Hz and the frequency of the modulation is B Hz then the side bands will appear at frequencies (A+B) and (A-B) Hz.
In this case it is important to note that the carrier frequency is fixed whilst the sideband locations are changing with speed.
If we examine the frequency difference between the fixed frequency and the sidebands then we find that the difference is always a factor of eight of the rotational speed. For example, at 1000RPM (16.6Hz) the difference between the carrier and the side bands is around 132Hz (Figure 6) and at 1200RPM (20Hz) the difference between the carrier and the side bands is approximately 160Hz (Figure 7). Secondary sidebands are also visible at 16x rotational speed.
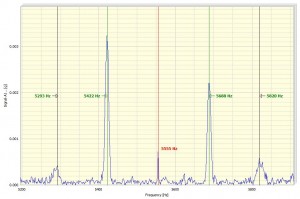
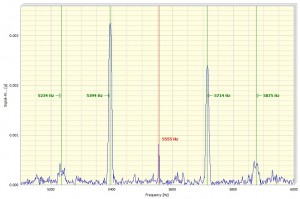
The observations show that a number of fixed frequency components are present in the vibration. These could well be due to resonances within the pump body or housing. The variable frequency components are no doubt caused by modulation which affects the signal on a cyclic basis. We know that the particular pump under test has 8 impeller blades, which matches the modulation frequency of 8 times the rotational speed.
As the impeller rotates around at speed, it can decelerate and then accelerates slightly around the revolution causing the modulation. The root cause may well be a blade fault on the impeller.
The modulation can be shown more clearly by band pass filtering the original pump vibration data. The result is a modulated sine wave.
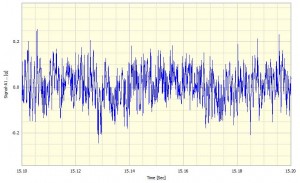
Figure 8 shows a section of the original time signal. Figure 8 shows the same section of the original time signal, but band pass filtered around one of the phenomena, in this case 5000Hz to 6200Hz.
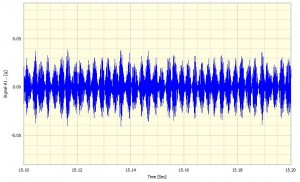
In Figure 9 it is hard to make any clear deductions, indeed there appears to be general a noise issue, however once band pass filtered, as shown in Figure 8, the amplitude modulation effect can clearly be seen.
This wave shape shows that the initial assumptions were indeed proven correct. A classical case of amplitude modulation causing sidebands in the frequency domain.
The presence of side bands around a central frequency is a well known phenomena and is discussed further in the following articles, written by Don Davies,
Bearing & Gearbox Vibration Analysis using Demodulation Techniques? (Part 1)
and
Bearing & Gearbox Vibration Analysis using Demodulation Techniques? (Part 2)
James Wren
Latest posts by James Wren (see all)
- What Are dB, Noise Floor & Dynamic Range? - January 12, 2024
- How Do I Upsample and Downsample My Data? - January 27, 2017
- What Are Vibration, Torsional Vibration & Shaft Twist? - November 8, 2016



Mr.James Wren,
I have analyzed something very similar to your data in the past. I hope you are doing the coastup of the motor driven pump by a variable frequency drive (VFD). This kind of behaviour is quite common due to harmonic and interharmonic excitations from the VFD, depending on the type of VFD. I believe what you are seeing is the VFD switching frequency (unlike the central resonant frequency as mentioned in the post) and its harmonics as the centre frequency and sidebands which is a function of your line frequency and VFD output frequency.These are indications of the poor quality of the VFD drive signal. The motor is driven by a modulated (not sinusoidal or corrupted?) current from the drive, which is the price (torsional) you pay for using a VFD.This type of behaviour often misleads the analysis and subsequent interpretations of the system (in this pump) under analysis.
Hello Jeyaselvan,
Thank you for posting on our blog.
Your input is very helpful and very accurate, thank you.
The source of this data was an automotive power steering pump test bench.
The pump on the test bench was indeed being driven by an electrical motor and there was a serious issue with noise from the drive, so much so, the whole test bench had to be redesigned and rebuilt.
It is very interesting that you were able to notice and deduce this just from the few graphs we have made available in this article.
I believe this shows that the wisdom gained from experience can not easily be replaced by anything other than hard work and time.
Thank you for your input.
Pingback: Cyclic Events in Rotational Analysis - Analysis of Engine Vibration - Prosig
Pingback: Rotational Analysis with no Tachometer Data Copy - Prosig Noise & Vibration Blog