
Tools for motorcycle dynamics analysis – Prosig DATS and Structural Animation Viewer
Mechanical engineering covers a vast field of topics, but not many fields feature higher dynamics in time and space than the engineering of race motorcycles.
The interplay of today’s high-performance four-stroke engines with stiff and lightweight motorcycle chassis is a challenging marriage, even with contemporary mechatronics add-ons, like anti-lock-brake, stability control and other systems.
While subjective driver testing is a well-established and valuable basis for decision-making, combining objective test data gives superior progression through this demanding task.
Simulation tools have made huge advancements over time. However, the ultimate nail in the coffin of inappropriate theories and speculations is actually conducting high-performance measurements, professional data analysis and data visualisation: seeing is believing.
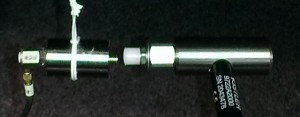
On the measurement side, the facilitation of MEMS accelerometers offers opportunities as they can measure contributions at extremely low frequencies and at frequencies relevant to engine dynamics concerns, that is, forcing frequencies.

Thus, measurements can be conducted that hint at the “understandable” impetus of engine dynamics to vehicle performance issues.
However, to have sound data at hand, careful pre-studies must be done beforehand to investigate the measurement chain regarding the behaviour of offset, drift and overdrive recovery.
Words of advice: these measurements are not for the faint-hearted or inexperienced data analysts; others might learn the hard way about the art and science of data acquisition in harsh environments to obtain high-fidelity datasets.
Advertisement
COMPLEXITY MADE SIMPLE
From sensors to DAQ to analysis & reporting, Prosig supports your entire measurement chain
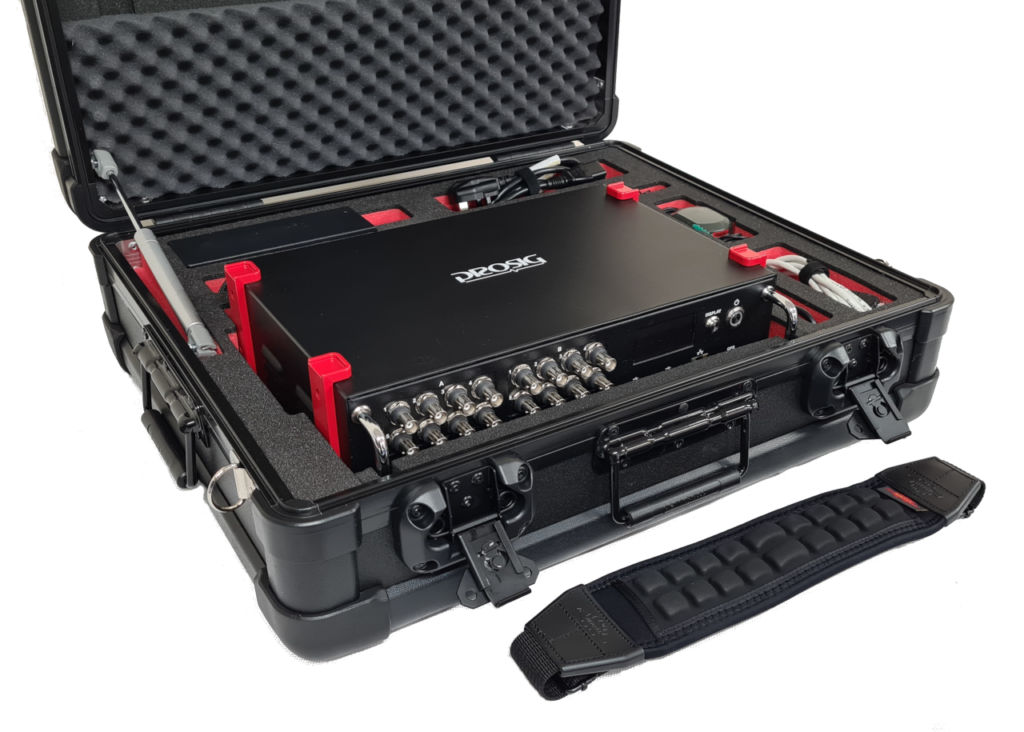

Whether you need accelerometers from our colleagues at DJB Instruments, microphones, pressure sensors or something else, Prosig can supply them as part of your system. Or you can use your own. Discover more about the Prosig hardware and software range.
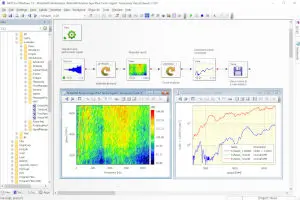
The Prosig DATS suite enables the NVH specialist to conduct all necessary steps to process datasets accordingly: time domain, frequency/spectral domain, order domain, and crank angle domain.
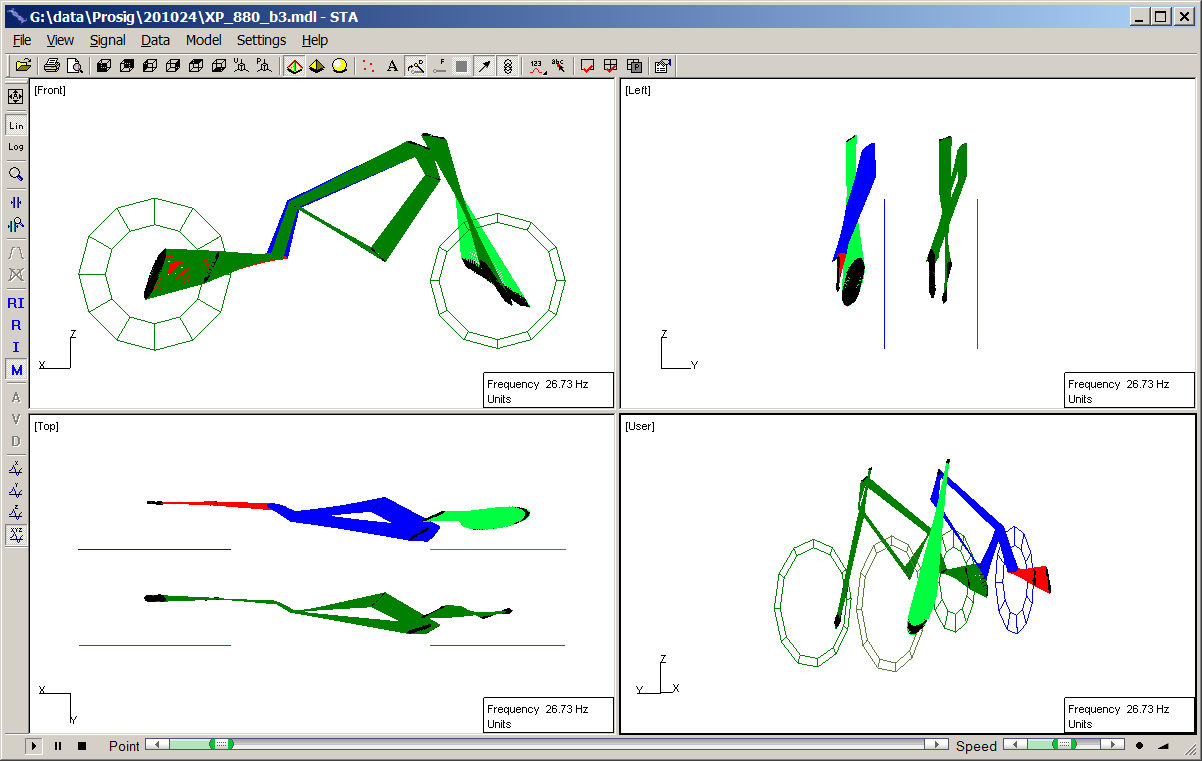
To the author, the DATS Structural Animation Application package, containing a Structural Animation Editor and a Viewer, is a very powerful, yet very easy to operate, tool to create wire-frame models of the structure under test, followed by an animation of acquired time data, as well as so-called operating deflection shapes. This is key to understanding the motorcycle dynamics we will look at.
The software easily builds the bridge between acquired measurements and simulation results originating from CAE tools for comparison and model updating.
Acquired time series dataset information can be directly visualized as animations in STA viewer.
Two examples are provided, one featuring an example from chassis analysis, e.g. a low-frequency structural issue:
The other example features a powertrain related issue.
Observe the time resolution: the animation video magnifies the time series data spanning over a time frame of merely about 1/100 seconds to a slow motion video of 20 seconds duration:
DATS can calculate transfer functions from time data which conveniently yields the structure’s spectral domain operating deflection shape information. By choosing one arbitrary reference point, all other’s response magnitudes can be calculated, which yields a magnitude/phase relationship spectral dataset.
This is shown in the following animation for one frequency as an example:
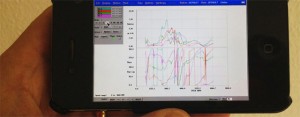
Two following images show an orbit-plot visualization of acceleration trajectories.


A useful option is the possibility of having side-by-side representations for different datasets displayed, which makes visual comparison easy. This can be seen in Figure 1 above.
Latest posts by Prosig (see all)
- Vibration Measurement Techniques: A Comprehensive Guide - August 30, 2023
- Tools for motorcycle dynamics analysis - November 3, 2022
- DJB Instruments Ltd joins Prosig as part of Condition Monitoring Group Ltd (CMG) - September 29, 2021

Pingback: Vibration Measurement Techniques - Modal Analysis