

When we measure vibration data, especially in conjunction with modelling systems, the measured data is often needed as acceleration, velocity, and displacement. Sometimes, different analysis groups require the measured signals in a different form. It is impractical to measure all three simultaneously, even if we could. Physically, putting three different types of transducers in the same place is impossible.
- Accelerometers are available in all types and sizes, with a very large choice. Some types will measure down to DC (0Hz), others handle high shock loading and so on.
- True velocimeters are quite rare, but they do exist. One interesting class based on a coil and magnet scheme is self-powered.
- Direct displacement measurement is not uncommon. Some use strain gauges, but many others use a capacitive effect or induced radio frequency mechanism to measure displacement directly. The capacitive and inductive types have the advantage that they are non-contacting probes and do not affect the local mass.
But in any case, it doesn’t matter because when we measure vibration, either acceleration, velocity or displacement, then it is surely simple mathematics to convert between them by judicious use of integration or differentiation, as illustrated below.
| Measured Signal Type | operation | Result |
|---|---|---|
| Displacement | differentiate | Velocity |
| Displacement | double differentiate | Acceleration |
| Velocity | differentiate | Acceleration |
| Velocity | integrate | Displacement |
| Acceleration | integrate | Velocity |
| Acceleration | double integrate | Displacement |
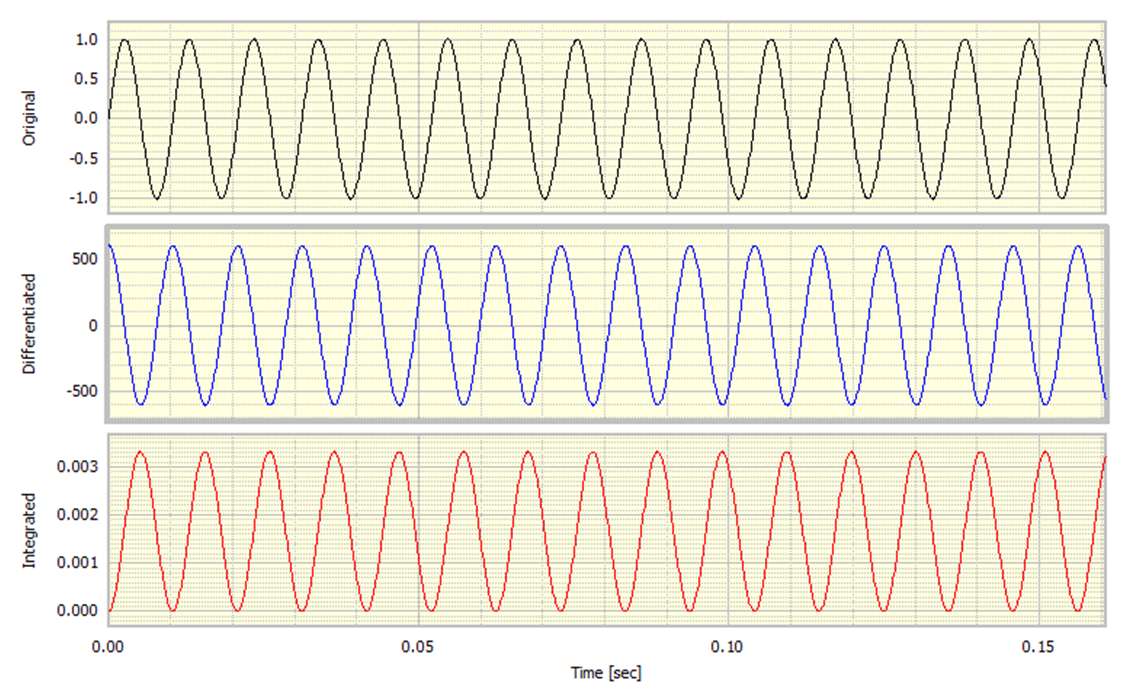
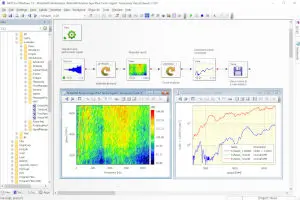
So now let us look at this with a classical sine wave signal and see the effects of either differentiating or integrating it. The example uses a 96Hz sinewave of unit amplitude to avoid other side effects with 32768 samples generated at 8192 samples/second. It is useful to look at these as time histories and as a function of frequency. The originally generated sinewave was processed using a DATS worksheet, as illustrated in Figure 1.

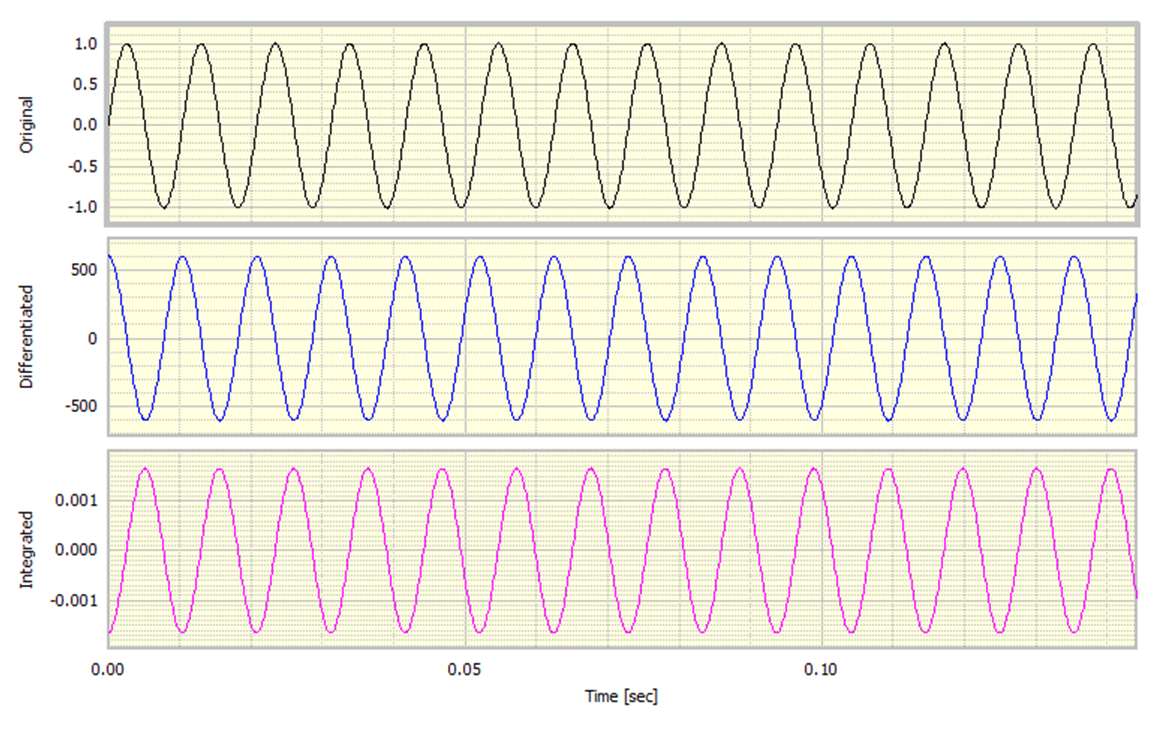
Looking at a section of the waveforms, we have a classical result, as shown in Figure 2.
In mathematical terms, if 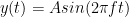


Advertisement
Sense | Capture | Analyse
From sensors to DAQ to analysis & reporting, Prosig supports your entire measurement chain
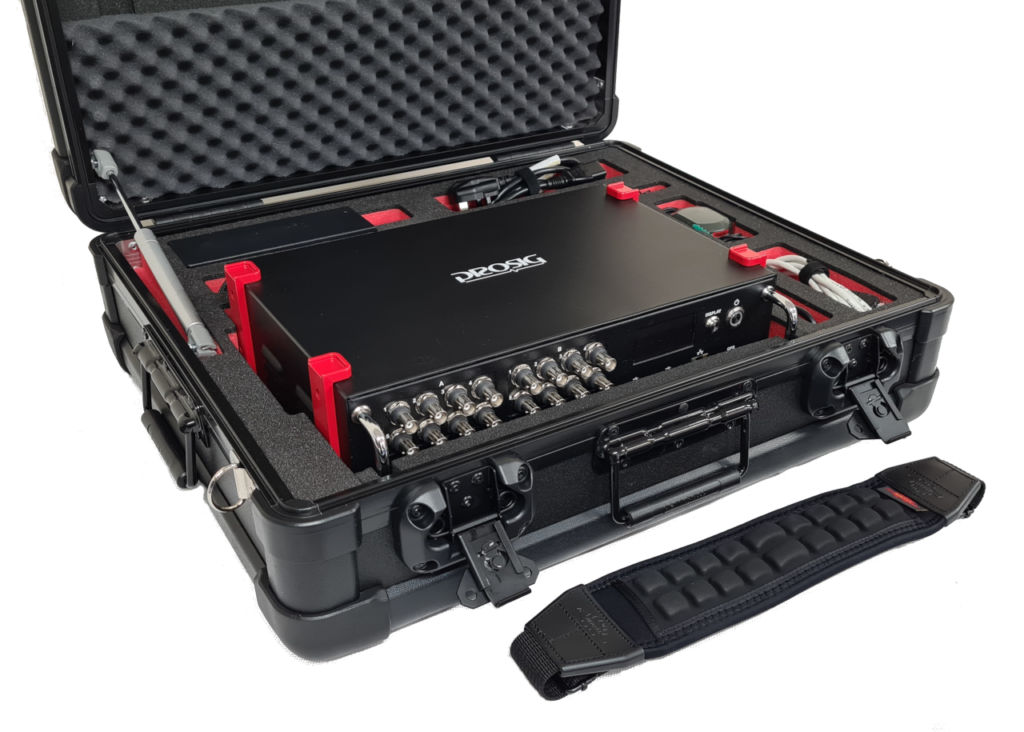
Whether you need accelerometers from our colleagues at DJB Instruments, microphones, pressure sensors or something else, Prosig can supply them as part of your system. Or you can use your own. Discover more about the Prosig hardware and software range.
For the mathematically inclined, it is the result of carrying out what is usually referred to as an indefinite integration. The solution is quite simple. After a standard time-based integration, we should automatically reduce the result to a zero mean value. That is, we ensure there is no residual DC offset. The calculation process was modified to include that action, and the result is shown in Figure 3. Note how the integrated signal is positive and negative, as expected.
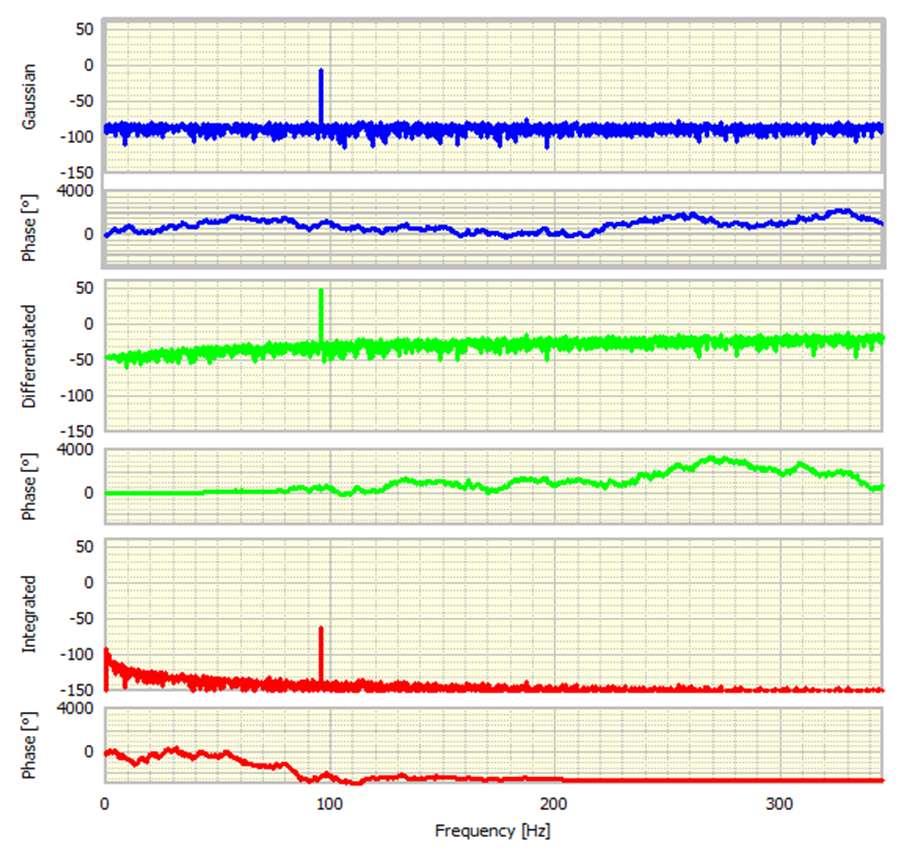
It is also interesting to look at the Fourier Transforms of the three signals. These are shown in Figure 4 in modulus (amplitude) and phase form. The moduli are shown in dBs, and the phase is in degrees.
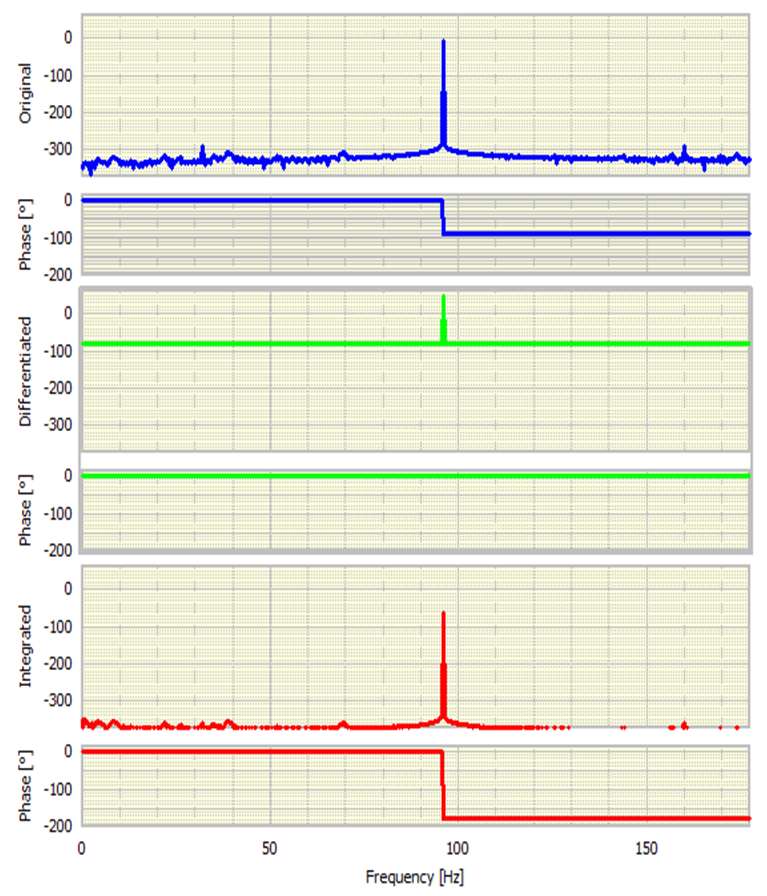
Looking first at the phase, the original sinewave has a phase shift of -900. This is entirely as expected because the FFT’s basis is a cosine. The differentiated signal has a zero phase change as it is now a pure cosine. The integrated signal has a 180-degree phase change, denoting it as a negative cosine.
The dynamic range of the original signal is well over 300 dB, which is not surprising as it was generated in software with double precision. This is approximately equivalent to a 50-bit accuracy ADC! The integrated signal shows a similar dynamic range, but what may appear surprising initially is that the differentiated signal has lost half of the dynamic range. We will return to this point later.
Small DC offsets are not uncommon in many data acquisition systems. Some offer AC coupling (highpass filtering) to minimise any offset. How would this affect the resultant signals? To illustrate this point a small DC offset of 0.01 (1% of the amplitude) was added to the original sinewave signal and the results are shown below.
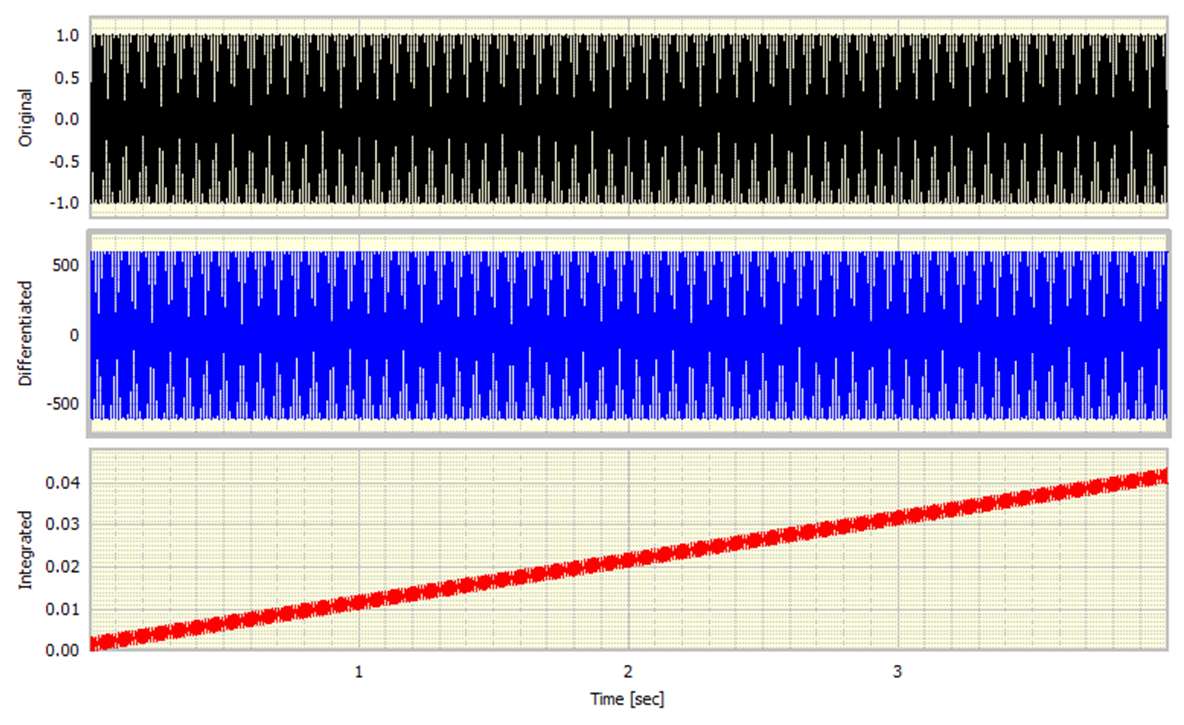
The effect on the original is essentially not noticeable. Similarly, the differentiated signal is unchanged, as would be expected. However, the effect on the integrated signal is quite dramatic. The small DC offset has produced a huge trend. We have integrated a 0.01 constant over 4 seconds, which gives an accumulated ‘drift’ of 0.04. The underlying integrated signal is still evident and is superimposed on this drift.
How do we avoid this? Simply reduce the input to a zero mean, often called normalising.
Note that at this juncture, we have not had to do anything to the initial signal when we are differentiating, but we have had to remove any DC offset before integration to prevent the ‘drift’ and also remove the DC offset from the integrated signal to eliminate the constant of integration. So, at this stage, one might be tempted to conclude that using a differentiating scheme might be the best way forward. However, when we add noise, the situation changes.
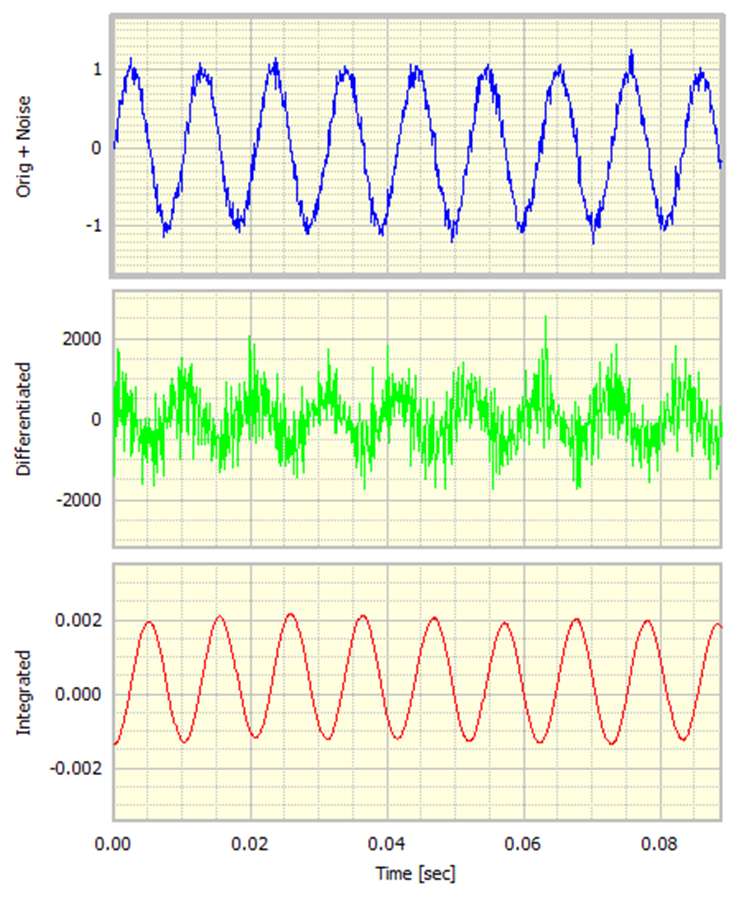
As a start, a small random noise signal was added the original sinewave.

The noise is not discernible to the eye on the original signal, but the differentiated signal has become very noisy. The integrated signal remains smooth. We can, however, identify the dominant frequency quite well.
If one examines the phase of the noisy signals, one can see it is now all over the place and essentially no longer has any value. Automatic phase unwrap was used, if the phase had been displayed over a 3600 range, it would have filled the phase graph area.
The dynamic range of the original signal with added noise is around 90dB, with the differentiated and integrated signals having a similar range. That is, the added noise has dominated the range.
One other aspect to notice is that the background level of the noise on the integrated signal rises at the lower frequencies. This is known as 1/f noise (one over f noise). This sets an effective lower frequency limit below which integration is no longer viable.
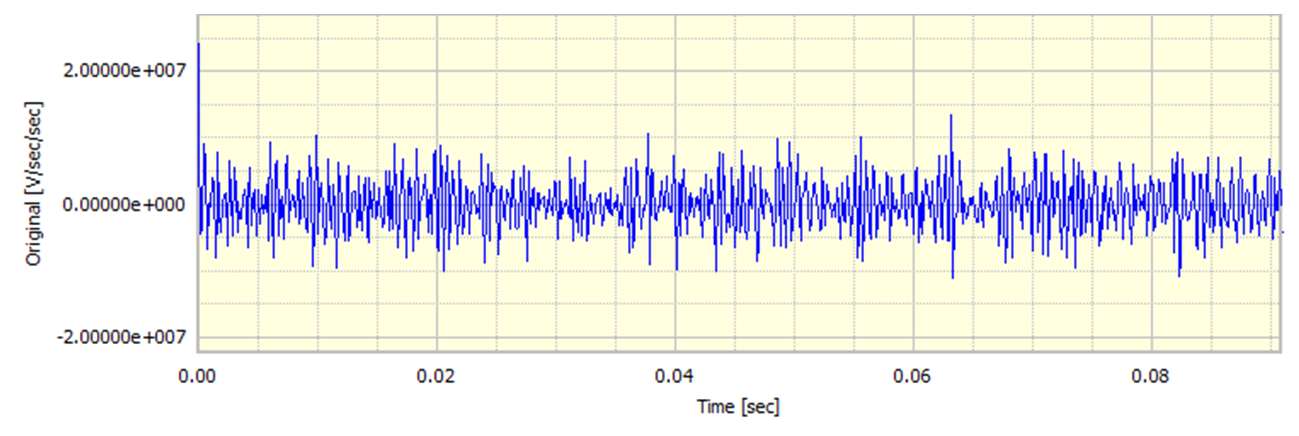
To emphasise the challenge of noise, the next example has a much larger noise content.
Here the noise on the original signal is evident. The differentiated signal is useless, but the integrated signal is relatively clean. To really illustrate the point, the noisy sinewave was differentiated twice. The result is shown below. All trace of the original sinewave seems to have gone or, rather, has been lost in the noise.
The conclusion is now clear. If there are no special circumstances, then experience suggests it is best to measure vibration with an accelerometer. However, care is required to remove the very low frequencies if any integration to velocity or displacement is needed.
As a final point, why should differentiation be much noisier than integration? The answer is that differentiation is a subtraction process, and at its very basic level, we take the difference between two successive values and then divide it by the time between samples. The two adjacent data points are often quite similar in size. Hence, the difference is small and will be less accurate, so we divide by what often is a small time difference, and this tends to amplify any errors. Integration, on the other hand, is an addition process. As any broadband noise tends to be successively differently-signed, then the noise cancels out.
This article, of course, does not tell the whole story, but it provides a very simple guide to best practice when we measure vibration – should we measure acceleration, velocity or displacement?
[Updated 04/07/2023]
Dr Colin Mercer
Latest posts by Dr Colin Mercer (see all)
- Data Smoothing : RC Filtering And Exponential Averaging - January 30, 2024
- Measure Vibration – Should we use Acceleration, Velocity or Displacement? - July 4, 2023
- Is That Tone Significant? – The Prominence Ratio - September 18, 2013


You mention in your article “Vibration Analysis – Should We Measure Acceleration, Velocity or Displacement?: Acceleration + Integrate ==> Displacement
To my opinion this should be: Acceleration + Double Integrate ==> Displacement
Kind regards,
Boyd Hardonk
Dear Boyd
Thank you for pointing that out. It seems a typo crept in when transferring the article to the blog. It has now been corrected.
Thank you again
Chris
It is known the better way to difrerentiate the noisy signal -to approximate the signal before.
Best Regards,
Yeugeny
Pingback: Velocity, Displacement & Acceleration: Science vs. Engineering « Sharad Sinha
if i’m doing the vibration analysis to the bearing to detect the failure, which is the better i use. the acceleration or velocity?
Informative article.But would be much helpful if a basic(lame man’s)explanation could be given..
does speed of a drive/machine (RPM) has something to do with selecting a right sensor??
Hi
This is really a very basic article trying to just show some guidance if you want Acceleration, Velocity and Displacement. The conclusion is that it is better to use an accelerometer transducer. The article does not attempt to be a layman’s guide on all the aspects in choosing a transducer, that is actually a tricky task because there are so many criteria and constraints. There might be environmental problems such as a very low or high temperature.
In the situation you mention then yes the speed of the machine on which you are taking measurements does matter. If the machine runs at a speed of up to say 6000 RPM this is a frequency of 100Hz. But how many orders (harmonics) of the basic speed do we need to measure? If we need to go to say the 15th order then that is a frequency of 1500Hz. So we want to make sure the accelerometer has a linear response bandwidth of say twice that value. Then we also need to ensure the acquisition system has a good analogue low pass anti-alias filter (it must have an analogue filter somewhere in the acquisition chain). We need to be able to sample at a rate typically 2.5 times the anti alias filter cut off frequency to allow for the finite cut off rate of the filter.
So there are multiple questions and scenarios. There are other Prosig articles which cover other aspects.
Colin
i am using vibration sensor which gives voltage as output.
how can i calculate to get acceleration from these voltage values?
Hi
all transducers have a voltage to physical units conversion factor for example an accelerometer could be 50mV/g. Beware MEMS type transducers as they may not be sufficiently stable. If there is no calibration certificate than I would not trust the device. What transducer are you using?
Colin
If using an accelerometer to measure vibration during CNC milling, what kind of output signal would i expect for no chatter vibration?
Chatter or No Chatter? Generally speaking chatter in a milling environment is a resonance phenomenon. There are two types of chatter: tool chatter or work-piece chatter. Tool chatter is when the cutting tool vibrates resonantly. And obviously work-piece chatter is when the work- piece is resonating.
When there is no chatter the signal would basically look random. When chattering there are large harmonic components. A word of caution however is to beware when milling work-pieces that have non uniform stiffness as these can generate cyclic forces.
In both chattering cases the vibration output will suddenly rise as milling speed increases and most often look like a large sine wave. Typically this is at a frequency corresponding to the rotational speed of the milling machine but it could be a harmonic.
So a simple, non intelligent, monitor would be on signal (acceleration) amplitude, probably RC smoothed with a short time constant to avoid transients.
In both cases it is probably best to monitor in the frequency domain. This will then show as a large ‘spike’ at the resonant frequency or possibly as a set of ‘spikes’ related to the harmonics of the resonant frequency, typically at 1st, 3rd , 5th and so on.
If chattering occurs then change the rotating speed, or if not possible reduce the milling force.
Colin
Dear Mr. Colin, Thanks for the valuable information shared. I have few queries which are stated below:
We have large sea water pumps in our plant of 60000 cu.m/hr of rated flow. These are tubular casing vertical single stage pumps having 300 RPM. The motor bearings have BN 330505 Velocity sensors installed. The output is displayed in peak on DCS after BN 1900 monitor processes the signal. Now the problem is that Alarm and Trip limits for vibration are set at 5.8 & 8.9 mm/s RMS and we see frequent alarms due to high peak values of vibration signal transmitted by the probes. Can you throw some light on how I can receive the output in RMS from these probes? Do I have to modify the existing BN 1900 or change the probes?
Hi
i am doing research on monitoring of ground vibration due to blasting in mines. and i am getting few doubts.please clarify me
1.which accelerometer is suitable to measure ground vibration
2.the blast induced ground vibration frequency range in between 10-20 Hz only
3.how can i convert accelerometer data into velocity
Hello, how are you.
I have a doubt about gs acceleration in vibration analysis.
What is the function of the gas acceleration in the analysis of vibration?
What acceleration gs measures in the analysis of vibration?
Would I like a more easy to understand explanation.
They say the acceleration gs measures energy, others say that friction me, I need a better explanation on this subject.
Thanks for listening.
att,
Reginaldo Vieira
Sertaozinho, SP Brazil
Reginaldo
I do not understand what you mean by ‘gs acceleration’? Do you mean acceleration measured in units of g’s
For reference an acceleration of 1g is 9.806 65 meters per second per second (m/s2).
If one has an acceleration it is not a measure of energy. Assuming you mean energy in a moving object then that is the kinetic enrgy which is related to velocity.
fo a steady velocity ov v m/s then kinetic energy is mv^2/2 where m is the mass.
Weight, W, and mass are related by 1g so m= W/g so kinetic energy becoms Wv^2/(2g)
Colin
You talk about a low bound frequency when double integrating the acceleration PSD to displacement. I am working on a project where we are taking acceleration readings and comparing to displacement acceptance criteria. The comparisons are made using RMS values. Our excitation is random broadband turbulence coupled with structural responses. The low frequency information is dominating the RMS value. Do you have guidance on how to select an appropriate lower bound for integration to displacement?
I am using accelerometer to pick the vibrations from the body but i need to convert it in to frequency so should i take the integral ?? please help me
Hi Ujaalaa,
Thank you for asking a question on our blog.
The short answer in No, you should not take the integral.
Fundamentally to convert to the frequency domain you would use the Fourier transform. Specifically the FFT or Fast Fourier Transform.
This would provide you with the frequency domain representation of your time domain signal.
If you then converted it from complex to modulus phase you would ‘see’ something that would make sense.
Usually for this purpose people would use the Auto RMS Spectrum or perhaps the PSD (Power Spectrum Density), or as it’s sometimes known the ASD (Autopower Spectrum density).
Hi,
My Boss asked me to take vibration reading on one of our equipment. I’m using IMI Model 687A02 Handheld Vibration Meter. When I took the vibration I used the ACC. instead of VEL.
My reading was 0.460. Can you help me how to explain this reading results and what unit of this reading? Thank you.
Hello Raymond,
Thank you for posting a question on our blog.
I’m afraid I could not comment on an IMI product as I have not used one before. Perhaps you could approach them directly?
I would imagine that ‘ACC’ is short for Acceleration and that ‘VEL’ is short for Velocity.
So if you had been tasked with measuring vibration I would have indeed used ‘ACC’.
With regards to the value of 0.460 I would imagine that was a measurement in units of g, or gravity.
I would suggest that IMI would be able to assist further.
Thanks,
James
Hello!
I’m trying to get vibration data from an accelerometer at a baudrate of 9600, from now I have acceleration data but when I apply FFT the data looks very unstable even if the accelerometer is not moving
Any suggestions?
Thank you
Monica
Hi Monica,
Thank you for posting a question on our blog.
It does sound rather like the implementation of the algorithm you are using for your FFT might be the issue.
You should have stability if nothing else.
If the accelerometer is not moving you should get a very simple result.
What signal processing software package are you using?
Hi James,
Thanks for your answer.
I use arduino to get the data from the accelerometer then I’m using python to do the FFT
Hi,
Thank you for this valuable post.
One question: can this technique used for extracting the displacement and velocity of a human arm to which an accelerometer sensor is attached? if so, does it need and modification?
Thank you
Murtadha
Pingback: Basic Vibration Signals