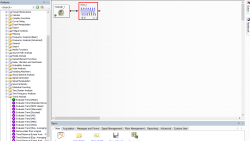
This tutorial guides a DATS user through the steps required to perform a moving average on a given signal. The tutorial explains the concept of the ‘Integration Length’ and the ‘Output Interval Step’.
Initially a signal is required to perform the moving average on. In this tutorial a sine wave will be generated. A sine wave is generated using the parameters shown in Figure 1.

The Sine wave will have a duration of 8 seconds and a frequency of 1Hz, with an amplitude of 5 m/sec/sec in this case.

Figure 2 shows the DATS user interface with the sine wave generated. Next the moving average must be performed on the sine wave. To perform the moving average the DATS analysis module as shown in Figure 3 is used.

Under ‘Trend Analysis’, the option ‘Evaluate Trend (Mean)’ is used. Other options are available, but not required for this tutorial.

Figure 4 shows the moving average analysis parameters. In this example the ‘Interval Style’ parameter is set to ‘Independent Units’, this parameter can be set to ‘Points’ or ‘Independent Units’. When set to ‘Independent Units’ the ‘Integration Length’ and the ‘Output Interval Step’ are measures of the X axis unit. For example, a signal where the X axis value is in seconds and an ‘Integration Length’ of 1 would mean the ‘Integration Length’ was 1 second. Where the ‘Interval Style’ is ‘Points’ and an ‘Integration Length’ of 1 would mean the ‘Integration Length’ was 1 point on the X axis.
In this example the ‘Integration Length’ has been set to 0.9 seconds and the ‘Output Interval Step’ is set to 0.4 seconds.
The ‘Output Interval Step’ is the amount the integration moves on the x axis.
So in this example, the first 0.9 seconds are used to calculate the first value of the average. Then the next value calculated uses data from 0.4 seconds to 1.3 seconds, the next point would be 0.8 to 1.7 seconds and so on. The resulting moving average is shown in Figure 5.

James Wren
Latest posts by James Wren (see all)
- What Are dB, Noise Floor & Dynamic Range? - January 12, 2024
- How Do I Upsample and Downsample My Data? - January 27, 2017
- What Are Vibration, Torsional Vibration & Shaft Twist? - November 8, 2016


Good explanation. One comment/question. When comparing with original signal, is the first averaged point set at 0 seconds, 0.45 seconds, 0.4 seconds or ?? what. In other words is the new signal offset due to the window average.
Hello David. The first point is at the mid-point of the integration length (so 0.9/2 = 0.45 in this case) it then moves by the step (0.4) and so subsequent points are at 0.85, 1.25, 1.65 and so on.
This is case for a number of software algorithms. But can cause downstream data handling problems. For instance the averaged signal will now have fewer points, possibly not in synch (depending on average window sizes and overlaps). So how does software, or defaults, work on subsequent multi channel processes – subtraction, division, or cross plotting for instance. Surely all other associated channels should be manipulated to keep synchronicity of points. Or does your software handle this. (It is often handled in different ways with other software tools – for instance reviewing all other channels and setting parameters to suit).