
Read more about the article Everything You Ever Wanted To Know About GPS But Were Afraid To Ask
Figure 4: Differential GPS (DGPS)

Everything You Ever Wanted To Know About GPS But Were Afraid To Ask

As you may know Prosig have recently released a GPS module for their popular P8000 series of data acquisition systems. The GPS module adds the ability to record accurate position information alongside all of the normal measurement channels. This is a highly useful capability and enables an engineer to easily correlate measured results with vehicle position and behaviour at the time. It also makes it simple to extract data based on position on a test track or road course.

(more…)

Continue ReadingEverything You Ever Wanted To Know About GPS But Were Afraid To Ask

10 Sites That Every Engineer Should Know About

Here’s another post inspired by an office discussion. We were discussing our favourite engineering based websites and realised the results would make a great blog post. So after a rummage through our bookmarks and a little further debate we’ve come up with our top ten sites. We tried to keep the list balanced so you’ll find a few resource sites, a little bit of fun and one or two sites that aren’t purely engineering sites, but contain valuable knowledge for engineers. Do you have a favourite site that we haven’t included? Why not add a comment below and give your favourites a plug.

(more…)

Continue Reading10 Sites That Every Engineer Should Know About

Noise & Vibration Capture with GPS Tracking

  • Post author:
  • Reading time:3 mins read
  • Post comments:1 Comment
  • Post category:news

The latest version of the CAN-bus/GPS (8440) module is now available for the Prosig P8012, P8020 and P8048 systems. The CAN-bus/GPS module has been in use in the field for some time now, recording CAN-bus information for display and analysis alongside noise, vibration, temperature and other signals captured by P8000 systems. The DATS software treats all analog and CAN-bus parameters in the same way so any mixture of parameters can be selected for display in real-time and subsequent processing. CAN-bus parameters can also be used to trigger immediate and pre-triggered captures and to stop captures.

The 8440 module now has an option to capture GPS parameters in addition to the other signals. The data capture software now also supports a realtime GPS track overlayed on a map. Velocity and altitude data measured by the GPS system can also be displayed alongside any other measurement channels in realtime displays. The latitude, longitude, altitude and velocity data is  stored with with all the other sensor data captured by the P8000 system and is available to view and process in the resulting datasets. These signals can then be used to classify or select data for further analysis. For example you could choose to process data when the vehicle is on a particular road or a particular section of the track, or if you find an unusual event use the GPS data to give a position and time or the event.

(more…)

Continue ReadingNoise & Vibration Capture with GPS Tracking

Comparison Between Sound Intensity Probes and Acoustic Cameras

Sometimes we are asked about the differences between an acoustic camera and a sound intensity probe and which of the two is better for a particular application. There is no straightforward answer as they are quite different pieces of equipment, used for measuring different things. An acoustic camera is a tool used to locate and analyse sound sources, usually both steadystate and dynamic phenomena. The intensity probe is used to find the sound intensity at a particular position, usually a steadystate phenomena.

(more…)

Continue ReadingComparison Between Sound Intensity Probes and Acoustic Cameras

Prosig launch new PROLOG data acquisition controller

  • Post author:
  • Reading time:3 mins read
  • Post comments:0 Comments
  • Post category:news

PROLOG - data acquisition controllerProsig have welcomed 2010 with the official launch of their PROLOG data acquisition controller.

PROLOG is a controller that will allow remote, unattended or standalone operation of a P8000 system. In normal operation a P8000 data acquisition system is connected to a laptop or PC and data is stored, in real-time, on the computers hard drive via the USB 2.0 interface.  This configuration provides a robust, high speed data capture environment. However, there are situations where it is not practical to keep the laptop connected. In some cases the environment may be suitable for the P8000 unit, but not for some of the more fragile components in a laptop. In other situations it may be desirable to have the measurement system in one location, whilst the operator may be positioned some distance away. The PROLOG unit is designed to address both of these requirements.

(more…)

Continue ReadingProsig launch new PROLOG data acquisition controller
Read more about the article A Simple Frequency Response Function
Figure 5: H1(f)

A Simple Frequency Response Function

The following article will attempt to explain the basic theory of the frequency response function (FRF). This basic theory will then be used to calculate the frequency response function between two points on a structure using an accelerometer to measure the response and a force gauge hammer to measure the excitation.

Fundamentally a FRF is a mathematical representation of the relationship between the input and the output of a system.

(more…)

Continue ReadingA Simple Frequency Response Function
Read more about the article Amplitude And Energy Correction – A Brief Summary
Figure 4: Energy corrected spectrum

Amplitude And Energy Correction – A Brief Summary

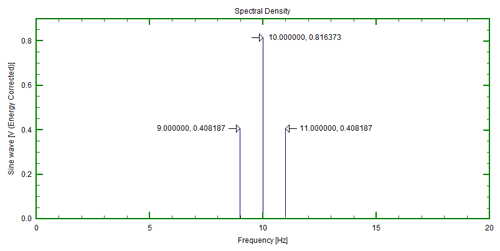
Amplitude and energy correction has been and is a continuing point of confusion for many people calculating spectra from time domain signals using Fourier transform methods. The first thing to say, the information contained in data presented as amplitude and energy corrected spectra is equivalent. The only difference is the scaling of the numbers calculated.

(more…)

Continue ReadingAmplitude And Energy Correction – A Brief Summary

Data Windows : What, why and when?

Before we discuss the use of data windows, we should first remind ourselves of three basic properties of the FFT (Fast Fourier Transform) process.

  • First, energy information in signal must be preserved during transformation. That is, the energy measured on time signal must equal the energy measured on the frequency representation of that signal.
  • Second, an FFT converts the signal representation between time and frequency domains. The time domain representation shows when something happens and the frequency domain representation shows how often something happens.
  • And finally, an FFT assumes that the signal is repetitive and continuous.

(more…)

Continue ReadingData Windows : What, why and when?

Interpolation Versus Resampling To Increase The Sample Rate

These are two different techniques aimed at different objectives. First consider a simple sinewave that has been sampled close to the Nyquist frequency (sample rate/2).

Figure1

Visually this looks very pointy. We will examine it using a filter based interpolation and a classical curve fitting procedure to obtain a better representation.

(more…)

Continue ReadingInterpolation Versus Resampling To Increase The Sample Rate

10 Great Fourier Transform Links

Joseph Fourier

Following a discussion in the office about Fourier Transforms we did a little searching on the web. As always, we discovered that the Internet is packed with some great resources on Fourier and his work. So rather than keep all of the information to ourselves we thought we should share it with our readers. We have whittled our list down to 10 links that we think represent the whole range of information from beginners guides to reference pages. So there should be something for everyone whether you’re a grizzled signal processing veteran or a student looking to learn something new. If you have your own favourite Fourier links then please add them to the comments. Maybe we could use them for a future blog post. Or if you have other comments please feel free to add them below.

(more…)

Continue Reading10 Great Fourier Transform Links

How To Analyze & Measure Torsional Vibration

Torsional Vibration MeasurementKnowing how to measure torsional vibration is of key importance in the area of vehicle development and refinement. The main contributory source is the engine where periodically occurring combustion cycles cause variation in the crankshaft rotary vibration. This vibration is transmitted to and modified further by other components in the powertrain such as the gearbox and by other equipment driven off the drive belt or chain. Additional torsional vibrations are also likely to appear downstream at the drive shafts and wheels.

(more…)

Continue ReadingHow To Analyze & Measure Torsional Vibration

What Is A Strain Gauge?

A strain gauge is an electrical sensor which is used to accurately measure strain in a test piece. Strain gauges are usually based on a metallic foil pattern. The gauge is attached to the test piece with a special adhesive. As the test piece is deformed, so the adhesive deforms equally and thus the strain gauge deforms at the same rate and amount as the test piece. It’s for this reason that the adhesive must be carefully chosen. If the adhesive cracks or becomes detached from the test piece any test results will be useless.

Strain gauges are used not just for metals; they have been connected to the retina of the human eye, insects, plastics, concrete and indeed any material where strain is under investigation. Modern composite materials like carbon fibre when under development are often constructed with strain gauges between the layers of the material.

(more…)

Continue ReadingWhat Is A Strain Gauge?

Shaft Displacement Measurement Using A PROTOR System

Shaft displacement is an important vibration measurement for rotating machines. Shaft displacement is usually monitored by non-contact shaft displacement probes such as eddy-current probes. These probes produce a voltage proportional to the distance of the shaft surface relative to the tip of the probe. For maximum benefit, ideally two shaft displacement probes will be fitted to measure the displacement in both the horizontal and vertical directions. Actually the probes do not have to be exactly horizontal and vertical as Prosig’s PROTOR system is able to resolve into the horizontal and vertical directions.

(more…)

Continue ReadingShaft Displacement Measurement Using A PROTOR System

Vibration Monitoring Phase Measurement And The Tacho Signal

Any vibration signal may be analyzed into amplitude and phase as a function of frequency. The phase represents fifty percent of the information so it is most important to measure phase for vibration monitoring. Most vibrations on a rotating machine are related to the rotational speed so it is clearly important to have a measure of the speed, either directly or as a once per revolution tacho pulse. A question sometimes arises as to whether a once per revolution tacho reference signal is needed to measure phase. Is it possible to get phase if we only have a speed signal? This note gives some insight into those questions.

Actually the question that should be asked is – “Can we measure a meaningful phase, for use in vibration monitoring, if we only have a speed signal as well as the vibration signals?”

(more…)

Continue ReadingVibration Monitoring Phase Measurement And The Tacho Signal

Human Exposure To Vibration In Buildings (DIN 4150-2:1999-06 & DIN 45669-1:1995-06)

Standards DIN 4150-2:1999-06 and DIN 45669-1:1995-06 provide a means of assessing the effect on human beings of vibration caused by vehicle traffic, trains both above and below ground, construction work and occasional impulsive type vibration caused by, say, blasting and the like.

DIN 45669-1 describes the signal processing actions and DIN 4150-2 details how these are used. Provisions are included for day or night levels and for five categories of building:

  • Industrial
  • Predominantly Commercial
  • Mixed Commercial and Residential
  • Residential
  • Special Areas such as Hospitals

(more…)

Continue ReadingHuman Exposure To Vibration In Buildings (DIN 4150-2:1999-06 & DIN 45669-1:1995-06)

Orders v Time – Comparing Overall Levels

By combining a speed signal with a data signal and using the Short Time FFT algorithm (Hopping FFT), it is possible to extract order data directly as a function of time (Orders from Hopping FFT) rather than as a function of speed (Waterfall). This is very useful when analyzing a complete operational cycle which includes run ups, rundowns and periods at operational speeds.

(more…)

Continue ReadingOrders v Time – Comparing Overall Levels

Calculating Velocity Or Displacement From Acceleration Time Histories

It is quite straightforward to apply “classical” integration techniques to calculate either a velocity time history from an acceleration time history or the corresponding displacement time history from a velocity time history. The standard method is to calculate the area under the curve of the appropriate trace. If the curve follows a known deterministic function then a numerically exact solution can be found; if it follows a non-deterministic function then an approximate solution can be found by using numerical integration techniques such as rectangular or trapezoidal integration. Measured or digitized data falls in to the latter category. However, if the data contains even a small amount of low frequency or DC offset components then these can often lead to misleading (although numerically correct) results. The problem is not caused by loss of information inherent in the digitisation process; neither is it due to the effects of amplitude or time quantisation; it is in fact a characteristic of integrated trigonometric functions that their amplitudes increase with decreasing frequency.

Continue ReadingCalculating Velocity Or Displacement From Acceleration Time Histories

Measuring Torsional Crank Shaft Jitter

Using Prosig’s P8000 series data acquisition system with DATS signal analysis software, torsional analysis (crank shaft jitter) was performed on an automotive engine attached to an engine dynamometer. The significance of this is that only one tachometer channel was required to identify crank jitter.

(more…)

Continue ReadingMeasuring Torsional Crank Shaft Jitter