Read more about the article Amplitude And Energy Correction – A Brief Summary
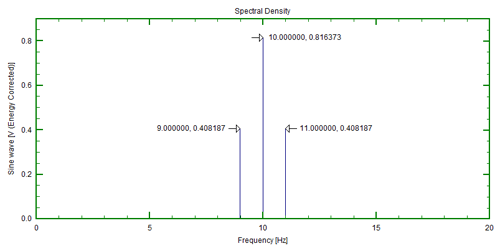
Figure 4: Energy corrected spectrum

Amplitude And Energy Correction – A Brief Summary

Amplitude and energy correction has been and is a continuing point of confusion for many people calculating spectra from time domain signals using Fourier transform methods. The first thing to say, the information contained in data presented as amplitude and energy corrected spectra is equivalent. The only difference is the scaling of the numbers calculated.

(more…)

Continue ReadingAmplitude And Energy Correction – A Brief Summary

Data Windows : What, why and when?

Before we discuss the use of data windows, we should first remind ourselves of three basic properties of the FFT (Fast Fourier Transform) process.

  • First, energy information in signal must be preserved during transformation. That is, the energy measured on time signal must equal the energy measured on the frequency representation of that signal.
  • Second, an FFT converts the signal representation between time and frequency domains. The time domain representation shows when something happens and the frequency domain representation shows how often something happens.
  • And finally, an FFT assumes that the signal is repetitive and continuous.

(more…)

Continue ReadingData Windows : What, why and when?

What Is A Fourier Transform?

A Fourier Transform takes a signal and represents it either as a series of cosines (real part) and sines (imaginary part) or as a cosine with phase (modulus and phase form). As an illustration, we will look at Fourier analysing the sum of the two sine waves shown below. The resultant summed signal is shown in the third graph.

(more…)

Continue ReadingWhat Is A Fourier Transform?