Normally when we are analysing a signal it is a purely real signal, that is it has no imaginary part. A classic example is of course a sine wave. When we analyse a signal with a Fourier transform, typically using an FFT algorithm, most people are aware that we will obtain a result from 0 Hz(DC) to (Sample rate/2)Hz. It is also generally understood that the resultant output of the FFT is a complex signal shown either in modulus (amplitude) and phase form, or in real and imaginary form. The real part is often referred to as the in phase component, and the imaginary as the quadrature component.
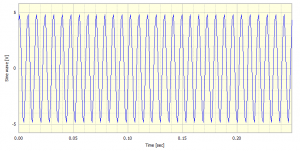
For illustration purposes suppose we have a sine wave of frequency 128Hz, an amplitude of 5 and with an initial phase of 60o. The initial part of this signal is shown in Figure 1. Now suppose we have sampled 4 seconds of this signal at a rate of 1024 samples per second. Obviously these values have been chosen somewhat artificially to avoid any end effects and to ensure that the signal frequency lies exactly on one of the FFT lines.
A regular FFT of this signal in modulus (amplitude) and phase form gives a result as shown in Figure 2.
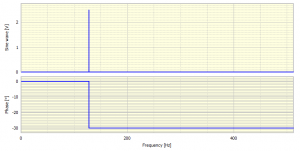
Notice that the amplitude calculated (using Prosig’s DATS software) is 2.5, which is exactly half the input amplitude. This is mathematically correct as will become apparent later. However, some software packages will give a result of 5, as the software automatically doubles the FFT result. We also notice that the phase is -30o but we started with a sine wave with a 60o initial phase. Again this -30o is correct because the FFT is defined with the cosine as the real part and sine as the imaginary part, so 0o in the FFT is with reference to a cosine wave starting at its positive peak value. In this frame of reference a sine wave with a 60o initial phase is identical to a cosine wave with a -30o initial phase.
For the mathematically inclined note
Showing the frequency range 0 to (Sample Rate)/2 is often called a half range Fourier transform. There is of course a full range transform, where we can choose to have a range from 0 to (Sample Rate) or from –(Sample Rate)/2 to +(Sample Rate)/2. The second form is actually simpler to interpret but involves accepting the concept of negative frequencies which may seem a bit strange at first. It is actually very straight forward. Let us go back to basics.
By convention a positive rotation is in the anticlockwise direction. If we look at the horizontal height of the end of a vector rotating with angular frequency , as illustrated below, then it traces out the sine wave
.

The past and future waves are shown.
Suppose now we look at the same setup but now the vector is rotating in the clockwise direction.

The actual shape of the waveform is of course identical. Thus if all we measure is the sinewave, we do not know when the wave started and we cannot determine whether it was generated by a vector rotating clockwise or anticlockwise. A positive frequency corresponds to an anticlockwise rotation, and a negative frequency corresponds to a clockwise rotation. From just measuring a real signal, as opposed to a complex one we cannot distinguish between positive and negative frequencies.
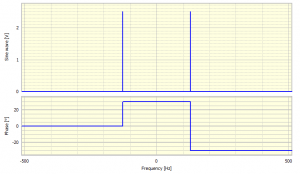
Suppose now we request a full range FFT of the same sine wave signal over the range –Sample rate/2 to +Sample rate/2. This gives the result as shown in Figure 5. There are now two components, both with amplitude of 2.5 but one at the negative frequency -128Hz and a phase of +30o, and the other one at +128Hz and a phase of -30o. These combine to give the one signal we started with. For a purely real signal then the amplitudes of the negative frequencies are a mirror of those from the positive frequencies, whist the phases are mirrored and inverted. As we can entirely predict the amplitudes and phases of the negative frequency components from the positive frequency components then there is no need to compute them as they add no more information.
In mathematical terms the modulus, , and phase,
, represents a signal
So we have the positive frequency component as
and the negative frequency component as
So the whole signal is given by
Now recall that
and
so we may write the negative frequency component as
which reduces the expression for the whole signal to
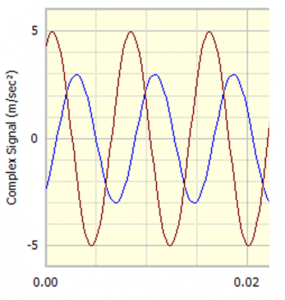
Suppose now we have two vibration signals, one measured in the horizontal axis and the other measured in the vertical axis. We may combine these two signals into one complex signal with the horizontal signal as the imaginary component and the vertical as the real component. As an illustration consider the signal where the imaginary part is [red signal in Figure 6] and the real part is
[blue signal in Figure 6]
If we plot the signal as real versus imaginary then it will be as shown in Figure 7.
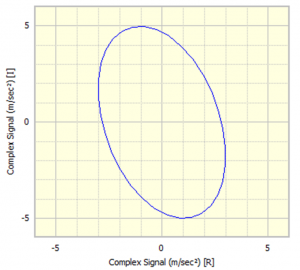
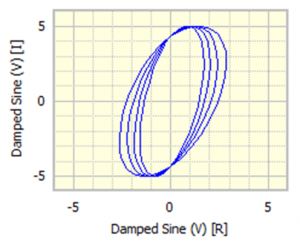
Because we have steady signals on both axes then the pattern repeats itself identically each cycle. In the example in Figure 8 one of the signals was varied in amplitude and the changing composite vibration pattern in time is readily observed.
The Fourier analysis of the two steady state signals is shown in Figure 9.
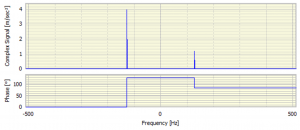
The amplitude and phase of the positive and negative frequency components are now very different. When shown as a polar diagram (Figure 10) we can see the two vectors quite clearly: one is approximately 3.94 at 127.5o and the other is about 1.21 at 85.2o.
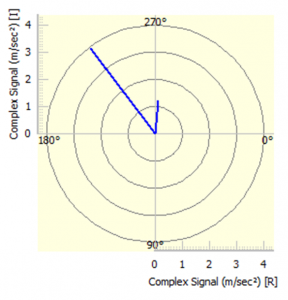
These resolve into a quadrature acceleration of 4.33 m/sec2 and an in-phase acceleration of -2.30 m/sec2.
Dr Colin Mercer
Latest posts by Dr Colin Mercer (see all)
- Data Smoothing : RC Filtering And Exponential Averaging - January 30, 2024
- Measure Vibration – Should we use Acceleration, Velocity or Displacement? - July 4, 2023
- Is That Tone Significant? – The Prominence Ratio - September 18, 2013


Thank you for all the information you post, I do both VA and remedial work i.e balancing and alignment and this particular issue has helped me a lot in understanding phase references ,an important aspect in dynamic balancing.
This is a good article on positive and negative frequencies. However people need to be mindful of the use, physical significance and sign convention of phase when applying to rotating machines – which of course is also dependant on machine rotational direction and angular orientation of transducers. Colin’s combined orthogonal plot of vibration measurements could also be thought of as a shaft orbit within a fluid film bearing. The spectral decomposition of the complex combined signal is otherwise known as a directional spectrum or as a “full spectrum” using Bently Nevada’s terminology. The physical significance of positive and negative frequencies for rotating machines, is that they represents the superposition of the directional modal contributions of the shafts forward and backwards whilring modes.