Generally. when developing and testing bearings a simple step by step procedure should be followed.

For the even the simplest of tests bearing vibration analysis must measure vibration along with rotational speed in revolutions per minute (RPM).
Therefore, at least two sensors are required – an accelerometer to measure the acceleration or vibration and a tachometer sensor to measure the rotary position.
Generally, we would suggest an IEPE accelerometer with a suitable frequency range and amplitude range for the bearing in question and the speeds involved.

It is important to note that the shaft speed in RPM divided by sixty is not the maximum frequency of interest. The maximum frequency of interest could well be the rotation speed multiplied by the number of rollers or a number of phenomena in the race. Or, in the case of a fault, it would be the number of occurrences per revolution. The point to stress here is that there is no simple rule for the maximum desired frequency range. Only with experience & knowledge of the bearing can final test specifications be decided.

As a guide, the technology for the tachometer sensor is quite open. Many types of sensors are available including lasers, infra red sensors, magnetic or hall effect sensors and many others.

Generally, one ‘pulse per revolution’ (PPR) is enough in most cases. However, up to, say, 30 PPR would not be overdoing it. More than that is not required for this type of test.

With the sensors prepared the shaft should be run through a range of speeds. Typically, we might go from zero to the maximum operating speed.
Then with the data from the sensors the analysis can be completed.
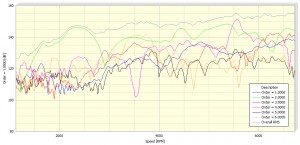
The analysis would consist of a speed based waterfall. This is simply a series of FFT spectra shown at different operating speeds. This would be followed by order extraction.

The order curves of the vibration signal can be used to find faults and identify good and bad bearings.

Further testing would have to be carried out to find the statistical average of a good or bad bearing or a particular faulty bearing.
Fundamentally it would be necessary to study the bearings dynamics to find the definition for a good or bad bearing and or what a fault looks like.
With regards to fault finding this can be a simple process of introducing a fault in a race, cage or even a roller itself.
Then by studying how these faults change the order curves it is possible to test new bearings and understand their internal state.
The following articles offer a more in-depth look at bearing analysis…

James Wren
Latest posts by James Wren (see all)
- What Are dB, Noise Floor & Dynamic Range? - January 12, 2024
- How Do I Upsample and Downsample My Data? - January 27, 2017
- What Are Vibration, Torsional Vibration & Shaft Twist? - November 8, 2016


