

In this post we will first look at how to process data from rotating machinery. Then we will focus on shaft or gear train twist. Let’s look at 3 different ways to measure and analyse rotating shafts. Each one has advantages and disadvantages and each is useful in different situations.
Method 1 – “Twist” or angular difference between tachometers
This is the study of the relationship between two tachometer measurements.
Measurements are taken from two tachometer signals. Typically this would consist of one tachometer from each end of a shaft, gearbox or similar component. The tachometer signals are recorded in the time domain.
If the shaft or gearbox has twist, that is the second measurement point of the shaft lags behind or in front of the initial measurement point, then the angle of the measurement positions is changing relative to each other. This is known as “twist”.
Method 2 – Angular vibration
This method allows us to study one particular part and how its rotational speed is changing over individual rotations.
We measure one tachometer signal on one component. The tachometer signal is recorded in the time domain.
The analysis is called ‘Angular Vibration From Tachometer’. It is sometimes known as ‘torsional vibration’ or ‘jitter’. The rotational speed of a component will rarely be constant during a rotational cycle even if the machine is running at a constant speed. Take an automotive engine for example, the combustion explosions that happen with each revolution will cause the crank shaft speed to increase and decrease fractionally. In an electric motor the speed is not consistent during the revolution as the motor turns past the magnets the magnetic field strength changes, thus the force changes and the speed will vary slightly.
Method 3 – General noise & vibration caused by rotating components
This method is used for the general study of noise and vibration caused by rotating components.
With one (or more) tachometer signals and a number of acoustic or vibration signals. The tachometer signal is taken from somewhere on the machine. The tachometer signal and other parameters are recorded in the time domain.
The signals are time sampled for easy frequency analysis, but can be converted to synchronous for engineers interested in order analysis. It is generally considered best practice that when performing frequency analysis the source data should be in the time domain and when performing order analysis then the data should be in the angle domain.
You can find our more about Method 3 in the article How To Analyze Noise & Vibration In Rotating Machines here on this blog.
The following will explain the process and steps involved in processing data captured from two tachometer signals to find the Angular Difference Between the two Tachometer signals. This is the measurement and analysis described in Method 1 above.
Step 1 – Data Capture
Capture a tachometer signal from each of the two points of interest on the shaft/gearbox/drivetrain/machine. These would normally be at either end, but could be from any two positions that we want to compare.
Generally, the data should be sampled at as fast a rate as possible. Prosig recommend 800,000 samples per second per channel for most applications, but higher is sometimes required. For example, in some situations we would recommend 240MHz.
Step 2 – Analysis
Analyse the tachometer signals to create the ‘Angular Displacement’ signal.
Below is the DATS processing worksheet required to process this data.

Our initial dataset contains two tachometer signals. For each of these we create a speed v time signal. This step is for additional information only and is not strictly necessary for the angular difference analysis. Next, each of the tachometer signals are analysed to produce the phase relationship between them. This is more commonly called the ‘twist’.
The results consists of three signals. In Figure 2 we can see the difference angle.
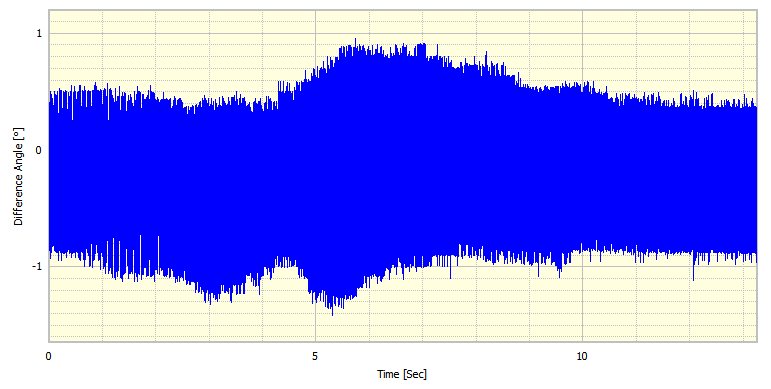
Figure 3 shows the speed v time curves for both tachometer measurements.

In Figure 2 we see the angular difference between the two tachometer measurements. This is plotted against time for the entire duration of our test. In Figure 4 we are showing only the first 1 second of the result.

In Figure 5 only the first 0.1 seconds of the signal is shown.
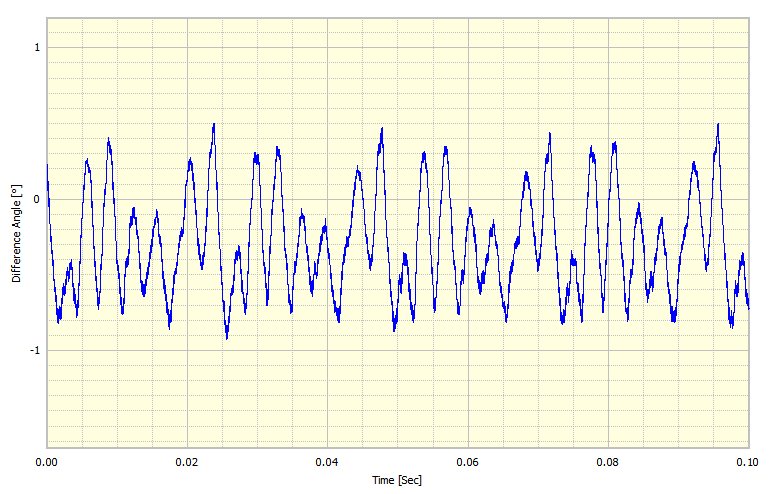
The important point to observe is the high level of detail that can be seen of the twist angle in degrees (sometimes called the phase difference). Figure 5 shows clearly how one end of the shaft is twisting compared to the other. If zooming in even closer further, smaller detail can be seen.
As can be seen in Figure 3 the speed of the shaft was increasing during our test measurement. This test method is equally valid for a steady state speed, an acceleration (run up) or deceleration (run down). It would depend largely on what phenomena we were trying to investigate or measure.
The magnitude of the twist angles can then be analysed and compared to the desired or required levels to confirm if the test specimen matches the intended specification.
James Wren
Latest posts by James Wren (see all)
- What Are dB, Noise Floor & Dynamic Range? - January 12, 2024
- How Do I Upsample and Downsample My Data? - January 27, 2017
- What Are Vibration, Torsional Vibration & Shaft Twist? - November 8, 2016


Dear James, I am very interested in order to perform this type of measurement. Could tell me the minimum equipment required to do so (model and quantity). The traditional way of measuring the phase is to install a small reflective tape, as it is in this case? I have quite a lot of interest in acquiring the equipment prosig to perform analysis of vibrations in rotating machinery, currently used CSI-2120. Many thanks
Hello Duberlis,
Thank you for posting on our blog.
I understand you have an Emerson analyser, this would not be suitable for the sort of capture and analysis listed above.
Initially you would require a data capture system, like the Prosig P8000, you would also require a signal processing software like Prosig DATS.
With regards to sensors, there are various you could use, for example a shaft encoder, an optical or laser tachometer with reflective tape, magnetic sensors positioned near a toothed wheel. There really are many possibilities.
You could use the reflective tape if you so desire, but I would not suggest it, due to the low number of pulses per revolution you could accurately and or easily get.
I would suggest you should aim towards at least 10 pulses per revolution for this sort of work.
Please feel free to post back if you have further questions at all.
Hello James,
this is an impressive article you wrote. I’m not so much into this topic but especially the first part helped me a lot to understand this topic more. Is there any possibility to say which method is the best or are they so much different that it is not possible?
Thanks a lot for your answer.
Henning
Hello Henning,
Thank you for posting on our blog.
We are glad to hear that you find the blog useful, thank you for letting us know.
The methods are all different and achieve different things, so you can not say which one is better, it depends on what your objective is.
The 3 methods are for 3 different objectives.
Please feel free to post further questions if it would help you.
hai james this is giridhar from GTRE, India
good article but still i feel you could have given little more thought by using strain gauge , rather it will be more simple.
thanks
Hi Giridhar,
It is nice to hear from you, thank you for posting on our blog.
I’d be happy to discuss in more detail some processes for the study of torsional phenomena using strain gauges.
Would you be able to share your experiences with us here?