When analysing a waterfall or performing order analysis it is important to consider the frequency resolution or the frequency spacing.
There is often a desire to increase the resolution to finer and finer detail. But that is a process of diminishing returns, and actually fraught with danger. And that danger is waterfall smearing.
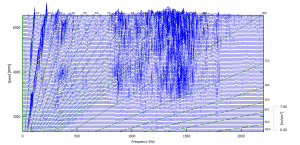
Figure-1 shows a waterfall created with a suitable frequency resolution. This has very little or no smearing.

To increase the resolution further, the block size has to become larger, the block sizes are always a power of 2.
The danger is the bigger the block size the more smearing in the waterfall. Waterfall smearing is caused by a wide range of speeds being included in each block.
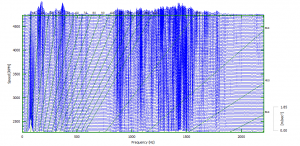
The waterfall plot is speed based. If the speed is changing quickly, say 100RPM per second and we have chosen a block size that encompasses 4 seconds of data then the RPM will have changed by 400RPM in that time. The orders will appear to ‘smear’ along the speed axis. This is waterfall smearing. See the example in Figure 2.

Figure 2 shows the same data as figure 1, but with a larger FFT block size.
In figure 1 the 2nd order is clearly visible, increasing with speed, but in figure 2 that same 2nd order is very unclear. The changes in speed have meant that the block size is too large and thus the speed has changed inside the FFT block. Further each FFT block is overlapping with the previous and the next.
The result is a waterfall or order analysis that is smeared.
James Wren
Latest posts by James Wren (see all)
- What Are dB, Noise Floor & Dynamic Range? - January 12, 2024
- How Do I Upsample and Downsample My Data? - January 27, 2017
- What Are Vibration, Torsional Vibration & Shaft Twist? - November 8, 2016

