
Case Study: What can I do if the transducer I am using has a non-linear sensitivity over its measuring range?
Abstract
Recently a PROSIG user wanted to measure a specific temperature parameter on a running engine. The transducer being used was one of the engine sensors built into the engine operating system to minimize engine emissions and maximize fuel economy. Unfortunately, the sensitivity of this transducer was not constant over the desired temperature range. The question then became, how can the output from this non-linear transducer be used to accurately measure the desired temperature parameter?
Approach
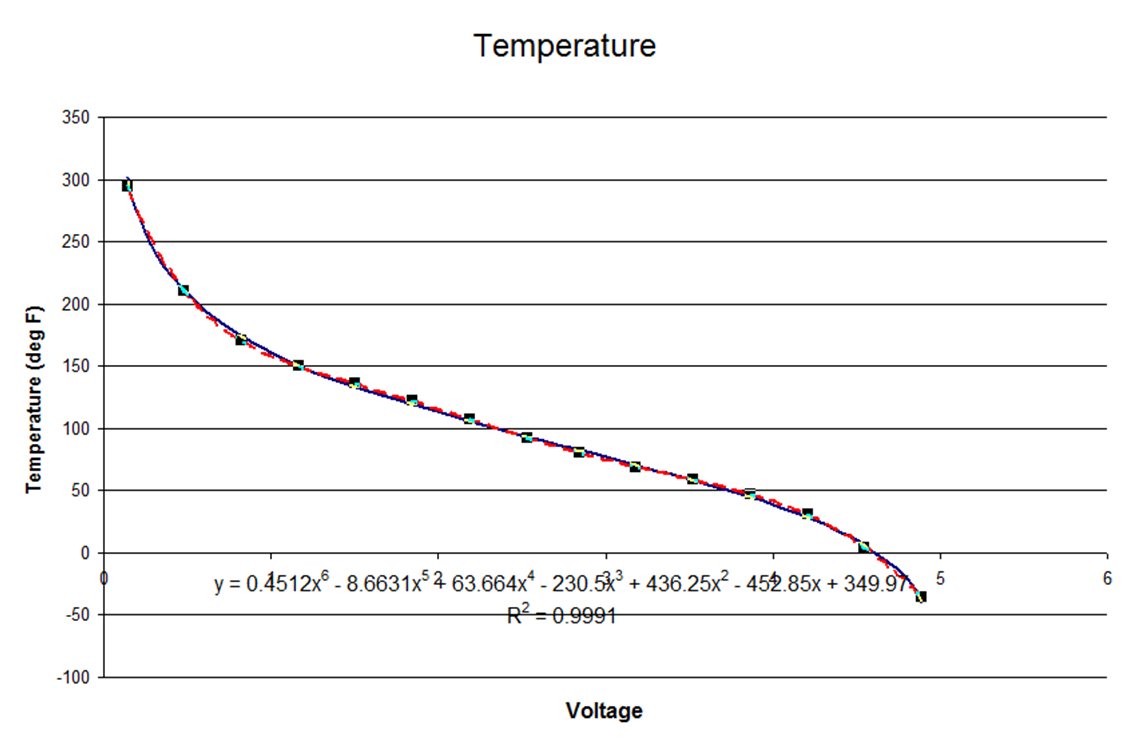
The sensitivity (V/deg F) was available in tabular format, so the first thing was to plot this data. MSExcel was used to plot the temperature (deg F) vs. Volts. This resulted in the curve shown below in Figure 1.

Obviously there is a linear portion of the curve between approximately 150 deg F and 50 deg F where one might use a fixed sensitivity, however the measurement of temperatures from -40 deg F to +250 deg F were required. Microsoft Excel has a tool which allows curve fitting of data. A polynomial curve fit was selected initially using 4th order. This provided a pretty good fit to the actual data (R2 value of 0.9947), however better accuracy was desire. A 6th order polynomial fit was calculated yielding a much better fit (R2 value of 0.9991). The equation for the fit line is shown along with the R2 value in Figure 2.
Now that we have an equation the Calculated Signal and Expression Editor features in DATS acquisition software can be used to calculate the temperature signal directly from the measured voltage signal.
Creating an Expression
An expression can now be created and saved using the Expression Editor found under the TOOLS pull down menu. The expression I created was:
0.4512*INTPOW(x,6) – 8.6631*INTPOW(x,5) + 63.664*INTPOW(x,4) – 230.5*INTPOW(x,3) + 436.25*INTPOW(x,2) – 452.85*INTPOW(x,1) + 349.97
which corresponds to the curve fit equation determined in MS Excel (Figure 2). This expression can be saved using a convenient name. Also, test values can be entered for ‘x’ and the result can be calculated giving the user confidence the expression is working as desired.
Creating a Calculated Signal
Now a calculated signal can be added to the list of channels in the DATS Acquisition channel setup screen by right clicking on the workspace and selecting Add calculated channel. The signal name for the calculated channel can be changed to some meaningful name. Moving to the right to the Expression Mode column, and double clicking on the field corresponding to the new calculate channel. A selection box appears allowing user to select the desired saved expression and to assign a measurement channel to be associated as “x” in the expression (Figure 3).

Calculated channels can be created using multiple measured channels
Summary
This feature in DATS Acquisition software greatly enhances the capabilities to directly calculate signals during the acquisition process. In this particular case the user was able to use the transducer built into the production engine for emissions and fuel economy, thus eliminating the requirements for timely and costly special instrumentation of the engine.
John Mathey
Latest posts by John Mathey (see all)
- Exhaust Vibration Measurement – A Case Study - March 11, 2016
- What Is Amplitude Quantization Error? - January 27, 2016
- Creating An End of Line Vibration Test System - February 25, 2015
