
In this tutorial we will be creating order plots using waterfall and intensity displays using use the DATS.toolbox and Rotating Machinery Analysis option.
To begin, a noise, vibration or other signal of interest should be captured along with a tachometer signal.
In Figure 1 we have loaded a time series (in this case an acceleration signal) and a time series of a tachometer pulse train into the DATS software.

Figure 2 shows the tachometer pulse train in more detail.

Next the DATS Rotating Machinery option is used to convert the time series of vibration and tachometer pulses into a waterfall and a speed signal. This process is shown in figures 3, 4 and 5.


The waterfall can be shown as an intensity plot, as shown in Figure 6.

The intensity plot can be shown in dB as seen in Figure 7.

It is possible to show order lines by changing the Graph Settings (Figure 8). Note the show order lines option is ticked.
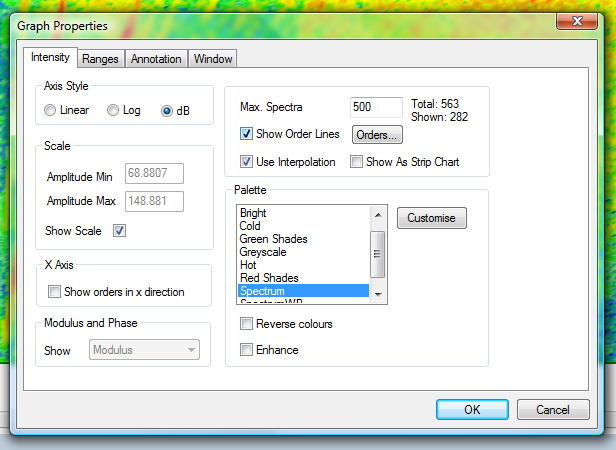
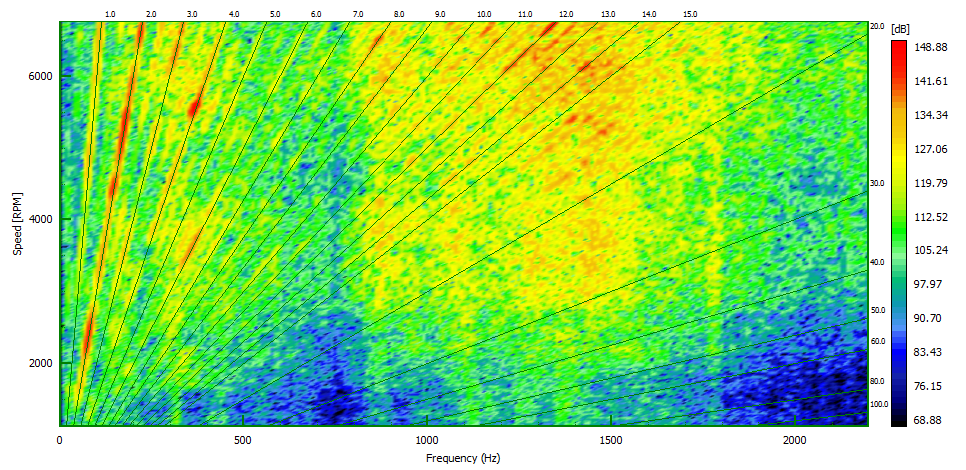
Figure 9 shows the intensity plot scaled in dB with order lines shown.
Next we use the Graph Settings again and select the option ‘Show Orders in the X Direction’ as shown in Figure 10.

The graph in Figure 11 will be shown. This graph displays the waterfall as an intensity plot with the X axis in the order domain.

James Wren
Latest posts by James Wren (see all)
- What Are dB, Noise Floor & Dynamic Range? - January 12, 2024
- How Do I Upsample and Downsample My Data? - January 27, 2017
- What Are Vibration, Torsional Vibration & Shaft Twist? - November 8, 2016
