The following article was written in response to a question from a visitor to the website. The gentleman in question had been reading some of the Prosig signal processing articles and had the following question.
Dear Sir,

It was interesting reading the articles in your mail.I would like
to know the options available in hardware and/or software for measurement/calculation
of phase angle of first harmonic of a vibration signal which is
sinosoidal. The phase angle is the relative phase angle difference
between the signal and the tacho - one into rpm signal.

Regards.
etc.
Dr Colin Mercer, Technical Director at Prosig, sent the following reply.
Dear Sir

Your enquiry has been passed on to me to answer. In short the answer
is a definite Yes.

I have attatched an example using a tacho and a phase modulated
sinewave in a word document. This shows the detail phase variation
as a function of time, which is like the phase lag in a motor but
is a bit more more complex! Because we use synchronous re sampling
techniques the method handles speed fluctuations as well.

The Prosig software you would need is the DATS package with the
rotating machinery option. We are very used to working with rotating
machinery and including power station turbines, electrical motors,
car engines, aircraft engines and so on. The simplest scheme is
if we can also acquire the data with our hardware – however
the software does have a lot of data import capabilities as well.

Colin Mercer
Ph D, BSc(Eng), FBCS, C Eng
Technical Director, Prosig
The remainder of this article contains the notes written by Dr. Mercer to accompany his reply.
Phase angle between signals
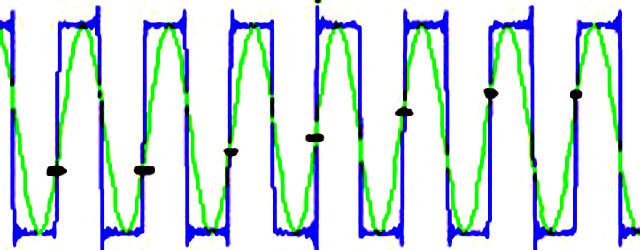
The objective is to demonstrate calculation of the time varying phase between a reference signal (tacho) and a sine wave. Two test signals were generated using standard DATS modules. The first signal was an eight second bandlimited tacho signal at 20Hz (1200 RPM). A section of this signal is shown below.
The other signal was a phase modulated sinewave, defined by
where the carrier frequency, , was also 20Hz, the phase modulation amplitude, m, was was set to 20 and the modulation frequency,
, was set to 2Hz. That is the phase varies as (
).
A section of this signal is also shown below.


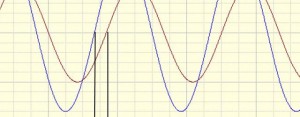
With only the sine wave to see, the phase variation is not clear. However, by overlaying the two curves the phase shift is apparent from where the sine wave crosses the tacho leading edge. The variation of the phase is quite evident.
The next step was to analyse the two signals to determine the phase angle variation with time. This used a standard DATS module available in the rotating machinery analysis section. This resulted in the “twist” signal shown above. As expected the angular phase variation is ±20° and cycles every half second.
The final graph is an overlay of all three signals, each to their own scaling.
The processing of the signals includes software resampling both signals synchronously using the tacho as the master reference.This allows for the situation when both signals are varying in speed, that is it is not necessary to have constant speed signals.
Dr Colin Mercer
Latest posts by Dr Colin Mercer (see all)
- Data Smoothing : RC Filtering And Exponential Averaging - January 30, 2024
- Measure Vibration – Should we use Acceleration, Velocity or Displacement? - July 4, 2023
- Is That Tone Significant? – The Prominence Ratio - September 18, 2013


please i need now defrant the phase angle vibration balancing
qundeel
You asked “please i need now defrant the phase angle vibration balancing” Did you mean you need to differentiate the phase angle to get rate of change of phase? You say this is in conjunction with vibration balancing. Actually we have extensive multiplane balancing software that is available with DATS. If you could explain your application a little more I may be able to help.
Colin
hi,i’m preparing for a paper presentation on signal processing.can u give ur suggestion as to what topics and aspects should b included in this.i’m in my 2nd yr. in B.Tech
Wow – what a question to ask a signal processor! There is so much. But if I had to limit myself to just one thing above all else it would be to look at the signal. Does it look like you expect it? Is it clipped? Did we actually measure anything? of many automatic systems “assume” the signal is good.
Generally the most used signal processing is frequency analysis – see for example https://blog.prosig.com/2003/07/29/notes-on-fourier-analysis/ what this class of analysis does is to express the information in term of frequencies as this is often easier to appreciate and to determine the origin. Here you have to distinguish between random data, transient data and periodic data. Each has a different progeny method; they all use Fourier analysis of course but in different ways.
Also no basic discerning signal processing is complete without considering aliasing.
Colin