The term synchronous data is usually applied to vibration or acoustic data that is captured from an item of rotating equipment at regularly spaced angle intervals as distinct from regularly spaced time intervals. The rotating part could be an engine, a gear wheel, a drive shaft, a turbine rotor, a propeller, a turbocharger or any other type of rotary mechanical device. Typically these items are subjected to out-of-balance forces that cause them to vibrate at frequencies that are multiples of the fundamental (once per revolution) rotation speed frequency.
These associated speeds are known as orders, with the 1st order being the once-per-revolution speed and a second order vibration being one that vibrates harmonically at twice-per-revolution and so on. In order to capture data at regularly spaced angle intervals one needs either a tachometer or shaft encoder that can generate an electrical pulse every time a threshold crossing is detected due to angular motion of the rotating element. This is why this type of data capture is described as being synchronous; it is locked into the rotation of the shaft and only exists at specific, discrete positions (rotation angles). It makes no difference how fast the shaft is rotating – there is always the same number of points captured per revolution. In fact, it is impossible to infer what the corresponding speed of the shaft is unless the times of the threshold crossings are also recorded somehow.
To understand this sampling scheme, consider the following animation which represents a time based approach. The gear is rotating at a constant speed, n, and the moving timeline represents a data sample being taken. We can see that the samples are regularly spaced in time.
 |
Now consider what happens if the speed of rotation increases. In the following example the gear wheel is rotating at twice the speed it was before, but our regularly captured data points in the time line remain the same. It follows that we are now recording only one half as much information for each rotation.
 |
Both of the above represent time based sampling. For an angle based or synchronous scheme we alter the sampling rate as the rotation rate changes. The example below shows the sample rate changing as the gear wheel speeds up and slows down. [Editor’s note: Please excuse the small jump in the animation when it loops back to the start.] We now see that the samples are no longer equally spaced in time. Instead, we will have the same number of points for each revolution and each of those points will be measured as equispaced angles around the rotation.
 |
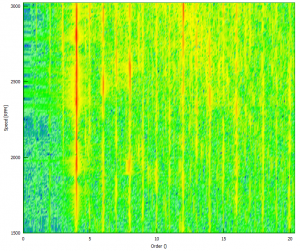
Historically, an electrical pulse was used to trigger the capture of one or more vibration signals that were being excited by the rotary motion. These digitized synchronous signals could then be analysed to find out how much the response was specifically due to once-per-rev forces, twice-per-rev forces and so on. Nowadays, it is more usual to sample data in the time domain and to determine accurately when the angular positions are reached. For example, the Prosig Advanced Tachometer module uses a 60MHz timer clock to pinpoint the times when the tacho thresholds are crossed. This allows either the angle of rotation itself to be analysed directly or used with interpolation methods to convert the time-based vibration data into synchronous (angle-based) data. In the same way that time-based data can be converted into frequency-based data by using a Fourier transformation, angle-based data can similarly be converted into order-based data by using a Fourier transformation. The benefits of working in the order domain can be seen in the example shown below of a waterfall analysis of vehicle vibration during a variable-speed run-up test. In the first example we see a frequency v speed waterfall that has been redrawn as an order v speed waterfall. We can see that this gives a reasonable representation of order information, but become less detailed for higher orders.

However, if we reprocess the data in a synchronous manner as described above and then process it again we obtain a waterfall graph as shown below. We can clearly see that the order information at higher orders is much easier to see and interpret.

You can find more information about analysing rotating machinery data in the angle/order domain in the following articles… Aliasing, Orders and Wagon Wheels by Dr Colin Mercer
Measuring Torsional Twist & Vibration Along a Shaft or Through a Geartrain by Dr Colin Mercer
Measurement And Analysis Of Torsional Vibrationby Adrian Lincoln
Measuring Torsional Crank Shaft Jitter by Chris Mason
Torsional Vibration, Tacho Pulses And Aliasing by Dr Colin Mercer
Adrian Lincoln
Latest posts by Adrian Lincoln (see all)
- Averaging Frequency Response Functions From A Structure - June 17, 2016
- Seismic Qualification Testing (Part 1) - June 14, 2016
- What is Operating Deflection Shape (ODS) Analysis? - September 1, 2014


