
The identification of cyclic events in rotational analysis is often key to identifying problems. It is good practice to use a suitable sensor for capturing rotational speed. However, this is not always practical or possible. Luckily, even for cases where no dedicated sensors for detecting rotation vibration are deployed, the DATS Rotating Machinery Suite will give very useful results as shown in this example.
In this example, time-series acquisition data on file (captured by a different manufacturer’s hardware) are used. They were captured with only a modest time resolution. The data was post-processed using DATS.
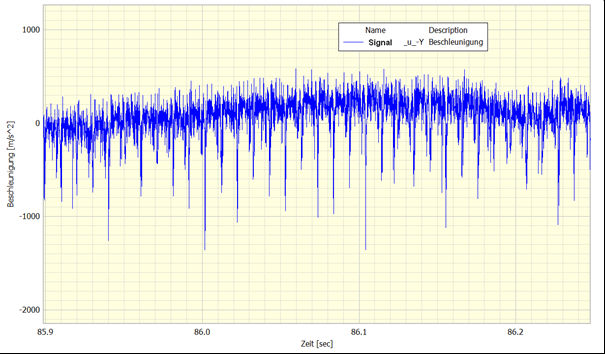
An engine run-up was performed. For one position located at the cylinder head, one accelerometer signal shows a powerful impulsive nature.
The DATS Rotating Machinery Suite features a module that calculates a synthetic speed curve from a spectrogram by selecting an engine order.
In Figure 1 a cut-out of the time signal is shown:
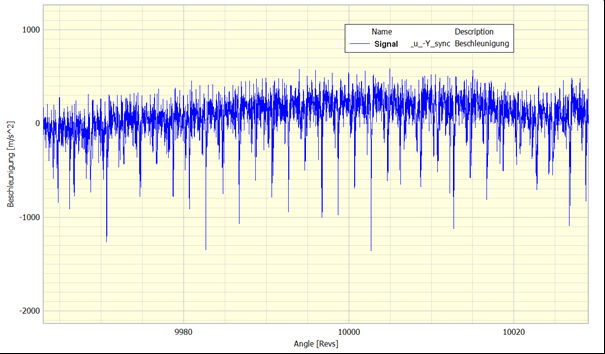
The graph in Figure 2 shows the signal after resampling to the synchronous/angular domain using the synthetic speed signal.
When the analysis is taken one step further, the consecutive engine cycle data can be visualized in a spectrogram-style type, “piled up as horizontal slices”. This way, irregularities can be spotted very easily, as is shown in Figure 3. This representation is the representation style for cyclic processes, like engine cycle analysis. It is vital to a full understanding of cyclic events in rotational analysis.

The (almost) vertical red spurs show the acceleration at the cylinder head due to the four cylinder’s combustion action.
Also, it is clearly revealed that the negative impulse (represented by blue dots around 600 deg crank angle)occurs ever at the same angle of the engine cycle, but intermittently and with varying prominence and level.
This representation easily allows the identification of the root cause of the phenomenon.
You will find more details of the DATS software and the Rotating Machinery Analysis functions here – DATS Software
[This article is an addendum to our previous post titled Analysis of Dynamic Engine Vibration – Angular Vibration in High-Performance Engines published in February.]
If you’d like to learn more about understanding cyclic events in rotating machinery you can explore the following…
A Method Of Diagnosing Cyclic Events In An Internal Combustion Engine by John Mathey
Vibration Monitoring Phase Measurement And The Tacho Signal by Dr Colin Mercer
Processing pump data – a classic case of amplitude modulation by James Wren
Latest posts by Prosig (see all)
- Vibration Measurement Techniques: A Comprehensive Guide - August 30, 2023
- Tools for motorcycle dynamics analysis - November 3, 2022
- DJB Instruments Ltd joins Prosig as part of Condition Monitoring Group Ltd (CMG) - September 29, 2021


