

An Impact Hammer double hit is viewed as a common problem, and most hammer impact testing software offers a “Double hit” rejection function. Signals captured with double impacts are not desirable and are generally considered unacceptable. In some instances, a double impact is unavoidable. However, it raises concerns regarding the adequacy and accuracy of the frequency response functions (FRFs), which determine the test structures’ dynamics.
The question is, does a double hit mean that the test must be rejected? In this article, we will investigate the influence of double impact theoretically and experimentally. Using the Prosig DATS software, we will demonstrate how to improve the signals where we have captured a double hit.
Impact Hammer Double Hit v. Single Hit
Figures 1 and 2 show signals of the excitation, response and FRFs measured from a single hit and a double hit, respectively. This helps explain what happens when the impact hammer double hit occurs.


Figure 1 shows a single hit, and Figure 2 shows two consecutive impulses applied to the test structure (a double hit). The time histories of both excitation and response signals show the superimposed vibrations captured by the accelerometer. The FRF for double hits (Figure 2) is not as smooth as that for the single hit (Figure 2). It is “contaminated” by undesired “noise”, which manifests as many spikes in the spectrum. We can also see a much poorer coherence result for the double hit, especially in the low-frequency range.
Advertisement
Some examples of the products from the CMTG brands
DJB Accelerometers
Sense

- Piezoelectric charge & IEPE accelerometers
- Instrumentation, cables & accessories
- Calibration & repair service

Prosig DATS Hardware
Capture
- Rugged, mobile data capture
- Options inc. 24-bits @ 300k samples/sec
- From 4 to 1000’s channels

Prosig DATS Software
Analyze

- Don’t just test – gain insight from your data
- Huge selection of signal processing algorithms
- Optional application add-ons
Generally, it is better to avoid double impact measurement when performing hammer testing if the test condition allows. However, from some researchers’ point of view, rejecting a double impact in all cases is not strictly necessary. They believe the key factors (e.g. resonant frequencies, mode shape, etc.) are still identified and can be extracted reasonably accurately if the input force power spectrum, FRFs observability and coherence level are acceptable. Therefore, the problem comes back to answering how we should evaluate the signals with double impacts and how to optimize or eliminate the effect caused by double or multiple hits from the measured FRFs.
Taking an impact test as an example, the time history of an excitation signal is y(t), the vibration response signal is x(t), and the FRFs are represented by matrix [H]. The corresponding Fourier transforms are expressed as Y(

If the data capture duration T is sufficiently long, the response excited by the impacts has been fully captured. Assuming the excitation signal contains a second impulse with a delay time of 

Rewriting the above equations, we find that

A valid impact test is based on linearity and time invariance assumptions. These assumptions guarantee that the FRFs do not change when the excitation force changes as the response keeps a linear relationship. For a typical impulse excitation, the Fourier Transform of the excitation signal shall have a relatively flat amplitude over broadband frequencies, meaning the energy applied to the system has been equally distributed across the frequency spectrum. However, because the system is excited twice with a “delayed” second hit, “periodical” ripples are observed on the excitation spectrum, as shown in Figure 3. The response signal also contains this “periodical” ripple as it is the superposition of the responses to two consecutive hits, as shown in Figure 4.
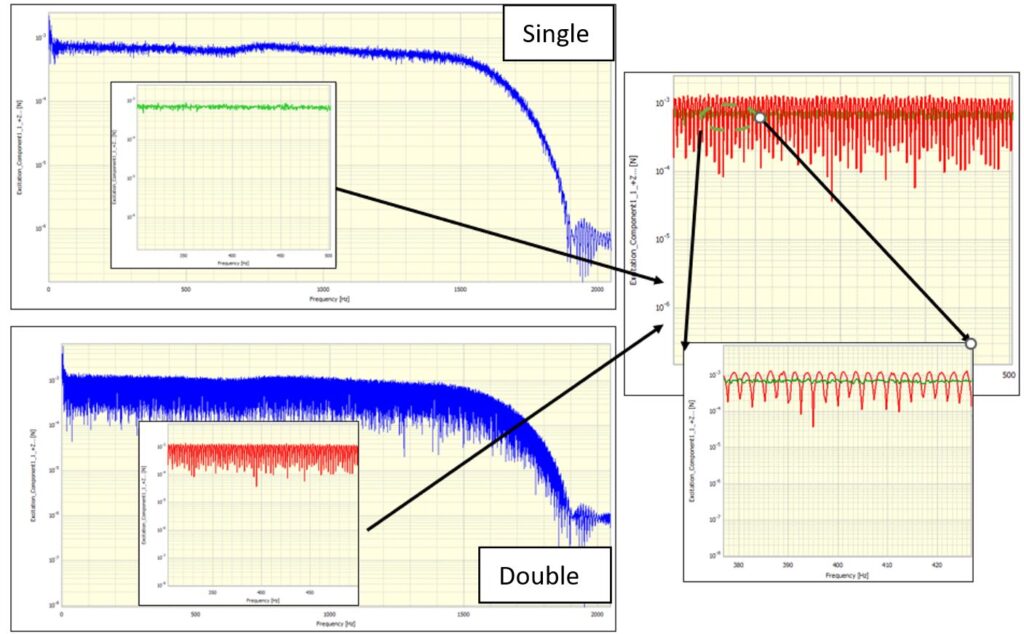

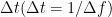
We can see that the ripples in the FFT graph are periodic. The pattern repeats every 


The concept of cepstrum analysis dates back to the 1960s. It has been applied in many applications. Initially, it was used for audio processing, speech processing, speech recognition, etc. Referring to Dr Colin Mercer‘s notes about Cepstrum, he explains the word “Cepstrum” as a corruption of the word “Spectrum”. The main advantage of cepstrum analysis is to detect the presence of sets of harmonics in a signal.
Cepstrum analysis is generally used for processing a composite signal whose rahmonics are separated by 

Taking advantage of the characteristics of Cepstrum, separating rahmonics which are closely spaced, becomes practical and easy to process. An extension of the cepstrum analysis for the decomposition of speech signals into their constituents was proposed by Oppenheim and Schafer.
Applying this extended complex cepstrum analysis to process the “contaminated” FRFs introduced by the second impact is presented in this article.
The multiple impulses (in our example, the second impulse) may be regarded as the convolution of the major impulse, the first impulse, and, similarly, the responses. This idea is to decompose the impulse signal into its constituents. Using DATS complex cepstrum module to perform linear filtering on the extracted components, the composite signal can be recovered in the time domain by using the liftering function on the un-desired rahmonics.
The following figures show the difference before and after the homomorphic deconvolution and liftering process.
Excitation signal


Response signal


Derived FRF


The ripples in the spectra of excitation and response introduced by the second hit have been effectively removed or attenuated. Furthermore, the quality of the FRF calculated is improved with clear peaks and smooth curve lines. The fake peaks are removed to avoid confusion.
Dr Cindy (Xin) Wang
Latest posts by Dr Cindy (Xin) Wang (see all)
- Impact Hammer Double Hit – An Investigation - June 13, 2023
- Some Basic Vibration Signal Qualities - August 17, 2022
- Automated data capture, analysis and reporting - May 10, 2022


it is a very helpful article.