This article is a follow on from What Is Resonance? (Part 1) and answers some of the issues not covered in that post.
How do you find the resonant frequency in the real world? What do you do when there is a situation with multiple peaks in the frequency domain data? How do you know the frequency you have found is a resonant frequency?
To answer any and all of the above questions can often be very simple, but sometimes, not so. Often there is a single clear peak in the frequency domain data that is easy to pick out, but sometimes there are many peaks. How do you find what you’re looking for in this case?
First, we have to explain what we are studying. In this article we will look at frequency response functions and how they are used to find a resonant or resonant frequencies.
For example, if we have a frequency response function from a hammer impact test, how do we find the resonance?
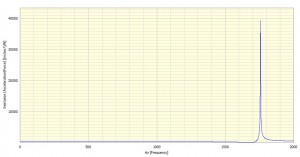
If we look at the magnitude or modulus part of the frequency response function in a raw format we’ll see something like that shown in Figure 1.

There is only one peak in this case, but how do we know for sure this is the resonance?
From the signal shown in Figure 1 we cannot say. We can make a best guess based on our understanding of the structure or part under test, but that is all.
So what do we need to make a judgement? The answer is phase.
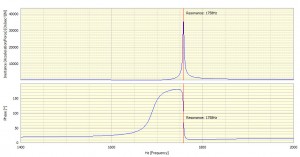
With both the modulus and the phase it is possible to make a decision upon which frequency is the resonant frequency.
If we look closely at the modulus and phase signals shown in Figure 2, we can see the frequency peak, but we can also see a peak in the corresponding phase.

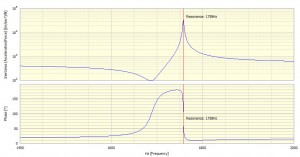
In Figure 3 we have zoomed in on the x scale to see the data more clearly. It is now possible to pick out the peak at 1758Hz. We have highlighted it using the DATS cursor marker function.

Pay careful attention to the plots of the peak and it is clear to see that the peak at 1758Hz does have a corresponding phase switch of 180 degrees. This is a classic sign of a resonance, a large peak associated with a flipping in phase.
Generally, an engineer will not see data this clear or obvious, but this article is intended to show the concept of how you would find a resonance in a simple system.

Further plots of this form would classically be shown on a logarithmic scale (or log scale for short). Figure 4 shows the same data on a log scale. Here both the resonance and the anti resonance are shown. The anti resonance was not visible at all on the linear scale, but shows itself and its phase inversion clearly in the log scale at 1689Hz. If not for viewing the data in the logarithmic form, this additional information would have been missed by visual inspection.
Further Reading & Viewing
A resonance occurs when a structure or material naturally oscillates at a high amplitude at a specific frequency. This frequency is known as a structural resonant frequency. Typically a structure will have many resonant frequencies.
Since resonance is such an important concept in noise & vibration measurement we thought we’d see what videos we could find to illustrate the phenomenon. So, here are 5 videos that show various aspects of resonance.
This article attempts to explain the basic theory of the frequency response function. This basic theory will then be used to calculate the frequency response function between two points on a structure using an accelerometer to measure the response and a force gauge hammer to measure the excitation.
James Wren
Latest posts by James Wren (see all)
- What Are dB, Noise Floor & Dynamic Range? - January 12, 2024
- How Do I Upsample and Downsample My Data? - January 27, 2017
- What Are Vibration, Torsional Vibration & Shaft Twist? - November 8, 2016


Hello,
Please tell me the reason it have to be 180 deg change when resonance?
what if the amplitude peak is not with the phase change, what is the peak normal means in physical phenomenon?
Hello Tylor,
Thanks for asking some questions on our blog.
For your first question, actually it is a little more complex than that.
As we detailed above if the frequency response function has a peak at a certain frequency and the phase shifts by 180 degrees, this indicates a natural frequency of the structure.
The natural frequency is actually the frequency in the middle of the phase shift.
If we assume a simple system, like a simple beam, then at frequencies below resonance the force and response are in phase.
At resonance the force and response are 90 degrees out of phase, but above resonance the force and response are 180 degrees out of phase.
The value of the natural frequency is determined by the dimensions of the structure and the wavelength of the excitations being reflected back onto themselves.
For your second question, an amplitude peak with no phase changes would indicate a response that is not a natural frequency. This can often be caused by a high amplitude frequency component of the excitation force.
If the natural frequency is at 90 degree phase shift why figure 3 indicates 180 degree phase shift at resonance.
If the structure is critically damped with no peak observed, can we read frequency with 90 degree phase shift to predict the resonance frequency of the un-damped structure?
Hello Sudipta,
Thanks for asking a question on our blog.
I think that at resonance the force and response are 90 degrees out of phase, but above resonance the force and response are 180 degrees out of phase. So taking a very specific frequency you will see or not the 180 degree shift. However in a more general sense, that is excitation if often not just a single frequency, the 180 degree observation is clear.
To your second point, no you can not.
Where there is an amplitude and a phase shift you have a resonance, if either of these components are missing then you do not have a resonance.
The issue maybe the structure or it maybe the forcing function, how you are exciting the structure for example. The excitation has to be of a wide frequency band and a high enough amplitude to excite the structures natural resonances.
What is the physical interpretation of anti-resonance?
Hi Farid,
Thank you for asking a question on our blog.
Basically in a structure there will be a frequency at which if a force is applied at a particular point, this force will not cause any motion of the structure.
These frequencies are known as the anti-resonances.
how is resonance applicable to sirens?
Hello Ryan,
Thank you for asking a question on our blog.
Sirens do not cause any sort of Resonance, so it is not applicable.
Perhaps your confusing Resonance and the Doppler effect?
How does a phase shift of 90 degrees at the resonant frequency creat such a high response? What is the physical meaning of this? Cheers
Hello Alan,
Thank you for asking a question on our blog.
At a resonance the phase will shift 180 degrees. The centre of this shift will enable you to find the frequency of the resonance.
The phase is the relationship between the input and the output basically. When they are opposites you have a resonance.
The resonance occurs when the maximum potential energy is converted to the maximum kinetic energy, that is the input and the output are opposites at a particular frequency.
Hello James,
I found these articles are very useful for non-experienced vibration engineers.
May I use your articles to trained our new engineers at my company.
Regards,
Hao Lam
Hello Hao Lam
James is away from the office for a few days so I will reply for him.
We are pleased that you like the articles. You are welcome to use them for training purposes. We only ask that you state that they came from Prosig. And maybe encourage your engineers to read the blog themselves 🙂
Regards
When we are using an accelerometer and Impact hammer , FFT of Accelerometer signal(response to impact of hammer) represents Natural frequency? If yes then why to use FRF?
Hello Samruddhi,
Thank you for asking a question on our blog.
That is a good question, the answer is that where you only have the FFT of the response, you would be looking at just that, the response.
You have no way of knowing what frequencies have been excited, there would be no coherence, so you would have not have any certainty in the validity of your results.
Also we should be clear the FRF is a transfer function in this case. It shows the energy and frequency that transfers from one point to another. The FFT of the response will just show the frequencies of the response when excited by an unknown force and in an unknown frequency range.
But in cases where we just need to find natural frequency of the object.we hit the structure with hammer and FFT of the response( accelerometer) clearly shows the amplitude is decreasing as the time passes but particular frequency does not even change slightly and from that,the one who is performing the test gets the clear picture of what natural frequency is for that object.
But in case of FRF, I would like to know what is the physical significance of the peaks in the magnitude-Frequency graph and what is the significance of the phase shift. Means how we can prove that the peaks we see in the magnitude frequency graph having corresponding phase shift of 180 degree, are natural frequencies?
In FFT, it is so clear that anyone can understand, if we are hitting the object, we can actually see decreasing amplitude but frequencies doesnt change.
Hello Abhijeet,
Thank you for posting on our blog.
I understand your question, if you think about what a resonance is you will conclude that the resonance occurs when the forcing function and the response are driving in opposite directions. That is they are out of phase by 180 degrees.
I think your point actually answers your own question, you can not be sure, just because there is a frequency that does not change that it is indeed a resonance. There are in practise many factors that could cause that effect that are not resonances.
Hi James and Chris,
Would like to know how to calculate modal mass and stiffness at a particular peak?
Hi James and Chris
We work on Car NVH problems using CAE. We have couple of questions.
Whenever we have issue with amplitude, more than reference or target, we check the behaviour of the structure at that frequency and in case of acoustic we see panels contributing to this particular high amplitude.
Based on high sensitive parts, when we work on design changes to improve, sometimes we don’t get any improvements even after many iterations. Sometimes we are clueless how to proceed?
Usually what would be the problems for high amplitudes? And how to root cause these and countermeasure? Please respond in vehicle point of view.
Also what approaches we need to follow to reduce amplitudes and what approach we need to follow shift frequency? In a nut shell we know applying (natural frequency as function of K and M) but to which parts we need to apply how that will effect in global values, sometimes we are not sure.
Most of the times, we are not allowed to use damping materials, and we have to work on structure, either add reinforcement, beads, modify Youngs modulus and/or change thickness. (Thickness increase in rare cases)
Hi Srini,
Thank you for posting on our blog.
I will address both your questions together if I may please.
I believe both your questions relate to finding the root cause of a resonance. This is going to be related to the structure your working on, so could well be different each time, there is no easy answer for every case I’m afraid.
It sounds like damping may not be possible for you for whatever reason, so that leaves modifying the structure or as is more common changing the excitation.
For example a generator running at 4,800rpm may excite a resonance, but if the speed is changed to 4,830rpm the resonance is no longer excited.
There are of course more complex solutions involving transmission paths and damping on route for example. But the simple solution’s are usually the best.
If there a quick and easy solution, yes, it’s the same as the long and hard solution, test, test and test more.