Exhaust Vibration Measurement – A Case Study

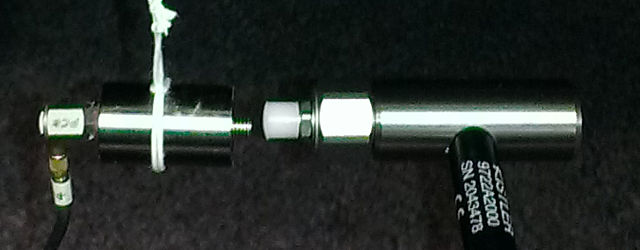
Exhaust Vibration Measurement - Customer Requirement One of Prosig's customers needed to perform exhaust vibration measurement on some of their vehicles. They contracted Prosig to take the measurements and provide reports of the…

Continue ReadingExhaust Vibration Measurement – A Case Study

Relative signal levels of a sinusoid with and without background noise

In the process of looking at some order data, a question about the accuracy of the measurement of the signal level of discrete frequency signals which were close to the general noise level.  To answer this question, a small DATS worksheet was created which generated 2 signals.  The first signal was a 35 Hz sinusoid which, by itself the spectrum level was measured to be approximately -9 dB (ref 1 V) as seen in Figure 1.

Spectrum level of 35Hz sinusoid
Fig 1: Spectrum level of 35Hz sinusoid

(more…)

Continue ReadingRelative signal levels of a sinusoid with and without background noise

Creating calculated signals with DATS Acquisition

Case Study: What can I do if the transducer I am using has a non-linear sensitivity over its measuring range?

Abstract

Recently a PROSIG user wanted to measure a specific temperature parameter on a running engine. The transducer being used was one of the engine sensors built into the engine operating system to minimize engine emissions and maximize fuel economy. Unfortunately, the sensitivity of this transducer was not constant over the desired temperature range. The question then became, how can the output from this non-linear transducer be used to accurately measure the desired temperature parameter? (more…)

Continue ReadingCreating calculated signals with DATS Acquisition
Read more about the article Amplitude And Energy Correction – A Brief Summary
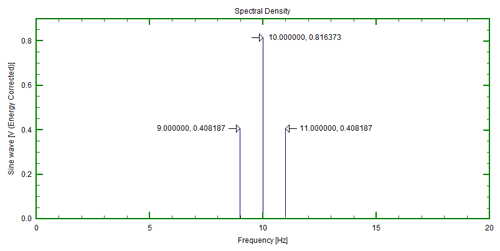
Figure 4: Energy corrected spectrum

Amplitude And Energy Correction – A Brief Summary

Amplitude and energy correction has been and is a continuing point of confusion for many people calculating spectra from time domain signals using Fourier transform methods. The first thing to say, the information contained in data presented as amplitude and energy corrected spectra is equivalent. The only difference is the scaling of the numbers calculated.

(more…)

Continue ReadingAmplitude And Energy Correction – A Brief Summary

Data Windows : What, why and when?

Before we discuss the use of data windows, we should first remind ourselves of three basic properties of the FFT (Fast Fourier Transform) process.

  • First, energy information in signal must be preserved during transformation. That is, the energy measured on time signal must equal the energy measured on the frequency representation of that signal.
  • Second, an FFT converts the signal representation between time and frequency domains. The time domain representation shows when something happens and the frequency domain representation shows how often something happens.
  • And finally, an FFT assumes that the signal is repetitive and continuous.

(more…)

Continue ReadingData Windows : What, why and when?