
New version out now – DATS V7.0.19 Released
The latest version of Prosig's DATS software was released today. This version contains a number of significant enhancements including new drivers for Prosig P8000 system that fully support 64-bit Windows…

The latest version of Prosig's DATS software was released today. This version contains a number of significant enhancements including new drivers for Prosig P8000 system that fully support 64-bit Windows…
The latest version of the DATS software package - V7.0.17 - is now available for customers to download. This version contains a great new productivity feature - worksheet zooming. It's…

Nowadays it is easy to attach extra screens to most computers. It is not uncommon to have a two or even three monitor setups. Even with laptops it is fairly easy to attach either a full size extra monitor or maybe a small screen via USB. To make full use of this extra screen ‘real estate’ one needs software applications that allow parts of the interface to be moved into separate windows. This process is often known as ‘floating’. The following article outlines how to use floating tabs in DATS Acquisition. This feature has always been important in automotive testing, but is now becoming more useful in other applications.

The objective of the brake noise tests was to record the braking events of cars being driven on various types of road and classify those events according to their type (Groan, Creep or Squeal etc) and severity. To do this the customer needed a system capable of working for long periods inside a vehicle in fairly tough conditions (high ambient temperatures, rough road) that was both quick to install and to remove.
On previous tests a system from another supplier had turned out to be unreliable and had failed to cope with the harsh environment. The analysis processing had also proved tedious and time consuming due to the huge amount of data created when testing several vehicles over many days.

Creating a good quality tachometer signal is one of the hardest parts of analyzing rotating machinery. So what happens if we have missing tachometer pulses? The data looked great until we tried to perform some in-depth torsional vibration analysis. And now we no longer have the component or vehicle to retest it. Do we have to scrap the whole test? Was all that time wasted? Not necessarily…

An investigation was made of a sample of automotive components where some were exhibiting a high frequency “tick” or rattle during each operating cycle. This feature could be heard above the normal operating noise. The problem this posed was to measure and analyze components in an objective fashion and classify components as “good” or “bad”.

It sometimes occurs that signals are captured with A-weighting applied to the data by the acquisition device. This can be a problem if, for example, you wish to use the data in a hearing test or to use it for a structural vibration analysis. Now, A-weighting allegedly mimics what the ear does to a signal. If we play back an A weighted sound then we perceive a double A-weighted signal which is clearly not intended. When doing structural work it is usually the lower frequencies, say 2kHz or less, that is generally required. A-weighting seriously attenuates the low frequencies and also applies gain above 1kHz.
 This note is based on a real requirement presented to Prosig by a prospective user. It’s the sort of challenge that we relish. This case is a great example of a real-world signal processing requirement and also great test of some of the unique features of Prosig’s DATS software. It also shows the power and flexibility of the new DATS V7.0 worksheets.
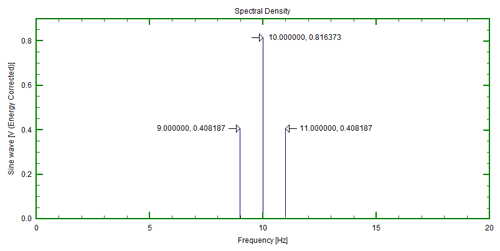
Amplitude and energy correction has been and is a continuing point of confusion for many people calculating spectra from time domain signals using Fourier transform methods. The first thing to say, the information contained in data presented as amplitude and energy corrected spectra is equivalent. The only difference is the scaling of the numbers calculated.
Before we discuss the use of data windows, we should first remind ourselves of three basic properties of the FFT (Fast Fourier Transform) process.
These are two different techniques aimed at different objectives. First consider a simple sinewave that has been sampled close to the Nyquist frequency (sample rate/2).

Visually this looks very pointy. We will examine it using a filter based interpolation and a classical curve fitting procedure to obtain a better representation.

 Knowing how to measure torsional vibration is of key importance in the area of vehicle development and refinement. The main contributory source is the engine where periodically occurring combustion cycles cause variation in the crankshaft rotary vibration. This vibration is transmitted to and modified further by other components in the powertrain such as the gearbox and by other equipment driven off the drive belt or chain. Additional torsional vibrations are also likely to appear downstream at the drive shafts and wheels.
The size and shape of the Prosig P8000 data acquisition systems greatly facilitates installation in locations that are small or difficult to access. Now Prosig can offer a new level…
Any vibration signal may be analyzed into amplitude and phase as a function of frequency. The phase represents fifty percent of the information so it is most important to measure phase for vibration monitoring. Most vibrations on a rotating machine are related to the rotational speed so it is clearly important to have a measure of the speed, either directly or as a once per revolution tacho pulse. A question sometimes arises as to whether a once per revolution tacho reference signal is needed to measure phase. Is it possible to get phase if we only have a speed signal? This note gives some insight into those questions.
Actually the question that should be asked is – “Can we measure a meaningful phase, for use in vibration monitoring, if we only have a speed signal as well as the vibration signals?”

Standards DIN 4150-2:1999-06 and DIN 45669-1:1995-06 provide a means of assessing the effect on human beings of vibration caused by vehicle traffic, trains both above and below ground, construction work and occasional impulsive type vibration caused by, say, blasting and the like.
DIN 45669-1 describes the signal processing actions and DIN 4150-2 details how these are used. Provisions are included for day or night levels and for five categories of building:
By combining a speed signal with a data signal and using the Short Time FFT algorithm (Hopping FFT), it is possible to extract order data directly as a function of time (Orders from Hopping FFT) rather than as a function of speed (Waterfall). This is very useful when analyzing a complete operational cycle which includes run ups, rundowns and periods at operational speeds.

It is quite straightforward to apply “classical” integration techniques to calculate either a velocity time history from an acceleration time history or the corresponding displacement time history from a velocity time history. The standard method is to calculate the area under the curve of the appropriate trace. If the curve follows a known deterministic function then a numerically exact solution can be found; if it follows a non-deterministic function then an approximate solution can be found by using numerical integration techniques such as rectangular or trapezoidal integration. Measured or digitized data falls in to the latter category. However, if the data contains even a small amount of low frequency or DC offset components then these can often lead to misleading (although numerically correct) results. The problem is not caused by loss of information inherent in the digitisation process; neither is it due to the effects of amplitude or time quantisation; it is in fact a characteristic of integrated trigonometric functions that their amplitudes increase with decreasing frequency.

The requirement was to develop a ‘standard’ test for assessing vehicle power steering pump noise (and sound quality). Measurements needed to be objective so that the method would be suitable…

Using Prosig’s P8000 series data acquisition system with DATS signal analysis software, torsional analysis (crank shaft jitter) was performed on an automotive engine attached to an engine dynamometer. The significance of this is that only one tachometer channel was required to identify crank jitter.
(more…)
We hear the word used a lot, but what is resonance? First, in order to explain we have to explain the terms we will use.

Prosig were recently involved in the validation of a closed loop control system for an automotive pump supplier. The customer has a large number of test cells, each test cell has 8 pumps continually on test. Each pump is instrumented with a revolution or tachometer sensor, giving a once per revolution tachometer pulse. Additionally, there are various analogue transducers on each pump which measure parameters, such as pressure at the pump inlet and outlet.
Order cuts are taken from a set of FFTs, each one at a different rpm. The rms level is then found as the Square root of the Sum of the squares of each of the FFT values. Mathematically, if 


This takes into account the entire energy at that speed both the order and the non order components, including any noise.

Accelerometers are robust, simple to use and readily available transducers. Measuring velocity and displacement directly is not simple. In a laboratory test rig we could use one of the modern potentiometer or LVDT transducers to measure absolute displacement directly as static reference points are available. But on a moving vehicle this is not possible.
 In many cases only significant events, such as bumps or other transients in a signal are of relevance. The objective is to be able to isolate these events in a meaningful manner so that they may be automatically recognised and either removed or extracted for analysis in a structured way.
There are two principle objectives initially: one is to be able to recognise an event and the other is to be able to mark it in some way so that subsequent software is able to operate on the actual event. We must also note that an event has a start and an end; the criterion we use to recognise the start may not necessarily be the same criterion we use to recognise the end. Searches for the start and end points are carried out on a Reference Signal. How the reference signal is formed is discussed in detail later, it includes the original signal, various running statistical measures such as the dynamic RMS, differentiation for slope detection, integration and so on. In many cases the start criterion will be some check on the level achieved by the reference signal. By the time any check level has been detected then it is almost certain that the event started earlier! That is, a pre trigger capability is essential.

The following application note shows the steps taken to perform structural analysis using a hammer impact test on an automotive exhaust pipe structure to improve the structural damping properties of the exhaust pipe mount. This application note follows up to a previous article – “Preventing Component Failure In The Fast Lane”.
A recent signal processing application note described how the Prosig sponsored Dalmeny Racing Formula Ford Team, whilst contesting the UK Formula Ford 1600cc championship, suffered several minor structural failures on a particular part of an exhaust pipe mount. Prosig dispatched a team of engineers, and after a brief survey of the damage, the engineers made an outline assessment. They concluded that “the exhaust itself is resonating at particular engine speeds. This is causing some shear forces in the mount. This in turn is causing stresses in the material leading to cracking and eventually failure.”
(more…)
