Fatigue & Durability Testing

The following application note describes the test and measurement process for the fatigue & durability testing and development cycle of an automotive suspension component, specifically a tie rod. The component had been known to fail at various intervals. An estimate of the predicted fatigue life of the component was required in order to assess the feasibility of its continued use and to see if a design change was required. The component under test is shown in Figure 1. The testing was carried out by a major automotive manufacturer. Strain gauges were used to monitor the strain levels.

(more…)

Continue ReadingFatigue & Durability Testing

Measuring Exhaust Noise Using A P8000 System

The following note describes measuring exhaust noise using a Prosig P8000/DATS system for the refinement of an automotive muffler design for a major after-market exhaust manufacturer in Europe. The particular vehicle under test was required by local legislation to have an overall radiated noise level of less than 70 dB. When tested, the vehicle was found to be producing 71.8 dB of radiated noise. The design of the exhaust system clearly needed to be reviewed and modified. (more…)

Continue ReadingMeasuring Exhaust Noise Using A P8000 System

Torsional Vibration, Tacho Pulses And Aliasing

With shafts, gears and the like, the general method of determining the rotational speed is to use some form of tachometer or shaft encoder. These give out a pulse at regular angular intervals. It we have N pulses per rev then obviously we have a pulse every (360/N) degrees. Determining the speed is nominally very simple: just measure the time between successive pulses. If this period is Tk seconds and the angle travelled is (360/ N) degrees then the rotational speed is simply estimated by 360/(N*Tk) degrees/second or 60/(N*Tk) rpm.

(more…)

Continue ReadingTorsional Vibration, Tacho Pulses And Aliasing

Analyzing Shaft Twist And Repairing Damaged Tachos

This post discusses analyzing shaft twist and at the same time handling the less than perfect data that we have all come across.

A shaft has been instrumented with two shaft encoders, one at each end. Each shaft encoder gives out a once/rev pulse and a 720 pulses/rev signal. Each signal was digitised at 500,000 samples/second. The objective is to measure the twist in the shaft and analyze into orders. The test stand was already equipped with a data acquisition system so a Prosig acquisition system was not required. Instead it was decided that the data captured by the resident system would be imported into the DATS software. The only format available from the customer system was ‘comma separated variables’ or CSV. This is not ideal as it is an ASCII based format and therefore creates very large files.

(more…)

Continue ReadingAnalyzing Shaft Twist And Repairing Damaged Tachos

A Simple Automotive Noise Test

In a recent article we described how the Prosig P8000 hardware and DATS software had been used to help Dalmeny Racing diagnose a problem with an exhaust bracket on their Formula Ford racing car. Whilst the car was instrumented for structural tests on the exhaust the opportunity was taken to carry out a simple automotive noise test. It was felt that these would provide some useful “real world” data as well as maybe providing some extra information regarding the exhaust bracket failure. After analysing and animating the hammer data it became clear that the engine runup data wouldn’t be needed. However, it was decided that some analysis should be carried out to see if the noise and vibration data backed up the conclusions of the other tests.

(more…)

Continue ReadingA Simple Automotive Noise Test

Phase Angle Between Signals

The following article was written in response to a question from a visitor to the website. The gentleman in question had been reading some of the Prosig signal processing articles and had the following question.

Dear Sir,

It was interesting reading the articles in your mail.I would like
to know the options available in hardware and/or software for measurement/calculation
of phase angle of first harmonic of a vibration signal which is
sinosoidal. The phase angle is the relative phase angle difference
between the signal and the tacho - one into rpm signal.

Regards.
etc.

(more…)

Continue ReadingPhase Angle Between Signals

Audio Equalisation Filter & Parametric Filtering

When working with audio signals a common requirement is to be able to equalise, cut or boost various frequency bands. A large number of hardware devices on the market provide this capability. The key aspect is that such filters are able to control bandwidth, centre frequency and gain separately. There are broadly two classes of filter used, a “shelving” filter and an “equalising “filter (also known as a “peak” filter). A shelving filter is akin to low pass and high pass filters. An equalising filter is like a bandpass or band reject filter.

(more…)

Continue ReadingAudio Equalisation Filter & Parametric Filtering

Cleaning Up Data

When we have a very noisy signal with a large number of spikes and signal bursts then if all else fails try Median Filtering. This is a technique often used in cleaning up pictures. The operation is almost childishly simple in concept but we will save the details until we have examined an example.

(more…)

Continue ReadingCleaning Up Data

What Is A Fourier Transform?

A Fourier Transform takes a signal and represents it either as a series of cosines (real part) and sines (imaginary part) or as a cosine with phase (modulus and phase form). As an illustration, we will look at Fourier analysing the sum of the two sine waves shown below. The resultant summed signal is shown in the third graph.

(more…)

Continue ReadingWhat Is A Fourier Transform?

Spectrum Smoothing : Why and How?

Sometimes data has spikes which are clearly artefacts of the processing or are due to some other external source. One is used to seeing these on time series but in some cases there are unrepresentative “spikes” in the frequency analysed data. Here we discuss how we can use spectrum smoothing to alleviate the problem. An example spectrum is shown below.

(more…)

Continue ReadingSpectrum Smoothing : Why and How?

Measuring Torsional Twist & Vibration Along a Shaft or Through a Geartrain

The measurement of torsional twist, or the twist angle, between two points along a shaft or through a gear train may be derived from a pair of tacho signals, one at each end of the shaft. Typically the tacho signals would be derived from gear teeth giving a known number of pulses/revolution. For example one end of a shaft could have a gear wheel with say 60 teeth giving 60 pulses/revolutions when measured with say an inductive or eddy current probe. (more…)

Continue ReadingMeasuring Torsional Twist & Vibration Along a Shaft or Through a Geartrain

Order Tracking, Frequency and Hertz

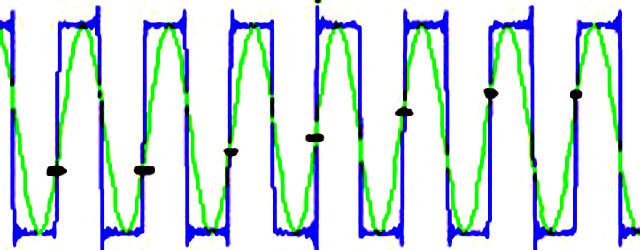
In this article, we look at the relationships between frequency, the unit Hertz and order tracking. The most common form of digitising data is to use a regular time-based method. Data is sampled at a constant rate specified as a number of samples/second. The Nyquist frequency, fN, is defined such that fN = SampleRate/2. As discussed elsewhere, Shannon’s Sampling Theorem tells us that if the signal we are sampling is band limited so that all the information is at frequencies less than fN then we are alias free and have a valid digitised signal. Furthermore, the theorem assures us that we have all the available information on the signal.

(more…)

Continue ReadingOrder Tracking, Frequency and Hertz

Dynamic Range And Overall Level : What Are They ?

Accurate measurement of a signal depends on the dynamic range and the overall level of the data acquisition system. The overall level setting may be thought of as determining the largest signal that can be measured. This clearly depends on the present gain setting. That is the overall level is related to the gain. Clearly if the overall level is too small (gain too high) then the signal will be clipped and we will have poor quality data. The dynamic range then tells us that for the given overall level what is the smallest signal we can measure accurately whilst simultaneously measuring the large signal.

In a very simple sense suppose we have an artificial signal which consists of a sinewave at a large amplitude A for the first half and that this is followed by a sinewave with a small amplitude a for the second half. We will set the gain (the overall level) to allow the best measurement of the A sinewave. The dynamic range tells us how small a may be so we can also measure that without changing settings.
(more…)

Continue ReadingDynamic Range And Overall Level : What Are They ?

High Pass Filtering And Tacho Signals

It is sometimes necessary to perform high pass filtering to eliminate low frequency signals. These may arise for instance from whole body vibrations when perhaps our interest is in higher frequency components from a substructure such as an engine or gearbox mounting. The vibration levels are speed sensitive and the usual scheme is to record a once per revolution ‘tacho’ signal with the vibration data. The tacho signal, which ideally is a nice regular pulse train, is processed to find rotational speed and hence to select which part of the vibration signal is to be frequency analyzed. The most common form of analysis is a waterfall type such as shown below.

(more…)

Continue ReadingHigh Pass Filtering And Tacho Signals

Don’t Let Spikes Spoil Your Data

In many real-world applications it is impossible to avoid “spikes” or “dropouts” in data that we record. Many people assume that these only cause problems with their data if they become obvious. This is not always the case. Consider the following two time histories.

(more…)

Continue ReadingDon’t Let Spikes Spoil Your Data

Non-Linear Calibration Curve And Polynomial

Not all systems vary linearly. One very well-known case is, of course, thermocouples. International standard curves are available for these, so they present little difficulty. The issue discussed here is determining a non-linear calibration curve and, if appropriate, reducing it to a polynomial.

(more…)

Continue ReadingNon-Linear Calibration Curve And Polynomial

A Weighting. And B. And C.

Some devices, particularly digital tape recorders, apply A-weighting to all their data to achieve acceptable data compression. This is fine unless you want to analyse the unweighted data or apply a different weighting factor. Using Prosig’s DATS software, it is a simple task to instruct the WEIGHT module to either unweight the data or remove one weighting factor and apply another.

(more…)

Continue ReadingA Weighting. And B. And C.

Understanding The Cross Correlation Function

To illustrate the use of the cross correlation function, a source location example is shown below. For this, it is assumed that there is a noise source at some unknown position between 2 microphones. A cross correlation technique and a transfer function like approach were used to determine the location. (more…)

Continue ReadingUnderstanding The Cross Correlation Function

How Do I Downsample Data?

Sometimes we have digitised data at a much higher rate than we need. How can we downsample data? If I wanted to say halve the sample rate can I just throw away every other data point?

The answer is NO, except in pathological conditions where you know that there is no frequency content above the new Nyquist frequency.

(more…)

Continue ReadingHow Do I Downsample Data?

Does The Signal Have A Gaussian Probability Density?

The PROB module in DATS for Windows provides, amongst other options, a probability density analysis. Also, the signal generation suite has a module, GENPRB, which generates a classical gaussian probability density curve (and others). How then may these be used to compare the probability density of our measured signal with that of a true Gaussian one. The method is quite straight forward and is a matter of scaling.

(more…)

Continue ReadingDoes The Signal Have A Gaussian Probability Density?