![Read more about the article [Video] A Simple Capture, Analysis and Report (Part 4)](https://blog.prosig.com/wp-content/uploads/2011/06/videoTutorials-640-2501.jpg)
[Video] A Simple Capture, Analysis and Report (Part 4)
http://www.youtube.com/watch?v=vZCKb4ikX1s This is the final part of our four part tutorial. This adds a report to the worksheet we developed in part 3.

http://www.youtube.com/watch?v=vZCKb4ikX1s This is the final part of our four part tutorial. This adds a report to the worksheet we developed in part 3.

http://www.youtube.com/watch?v=4ejGBG5ImfY Part two of the four tutorials showing a simple setup to capture, analyze and produce a report using Prosig’s DATS software and P8000 hardware. This part deals with setting…
http://www.youtube.com/watch?v=4ejGBG5ImfY Part two of the four tutorials showing a simple setup to capture, analyze and produce a report using Prosig’s DATS software and P8000 hardware. This part deals with setting…
http://www.youtube.com/watch?v=dGRzTxzUWfE The first part of a series of four tutorials showing a simple setup to capture, analyze and produce a report using Prosig's DATS software and P8000 hardware. Part 2…
http://www.youtube.com/watch?v=dGRzTxzUWfE The first part of a series of four tutorials showing a simple setup to capture, analyze and produce a report using Prosig's DATS software and P8000 hardware. Part 2…
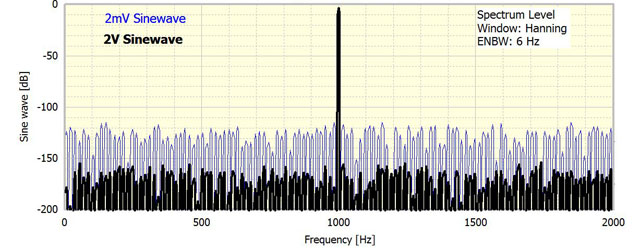
At least one manufacturer of data acquisition systems claims to achieve an incredibly high dynamic range (160dB) when capturing data. This is supposedly achieved by the use of dual-range data acquisition architecture. Such systems have two analog-to-digital convertors for each input channel; one of the ADCs captures the full voltage range of the input signal and the other ADC captures the input signal only when it is small. This article explains the facts behind the figures and shows that the use of Dynamic Range as a measure of precision can be misleading.

Nowadays it is easy to attach extra screens to most computers. It is not uncommon to have a two or even three monitor setups. Even with laptops it is fairly easy to attach either a full size extra monitor or maybe a small screen via USB. To make full use of this extra screen ‘real estate’ one needs software applications that allow parts of the interface to be moved into separate windows. This process is often known as ‘floating’. The following article outlines how to use floating tabs in DATS Acquisition. This feature has always been important in automotive testing, but is now becoming more useful in other applications.

The objective of the brake noise tests was to record the braking events of cars being driven on various types of road and classify those events according to their type (Groan, Creep or Squeal etc) and severity. To do this the customer needed a system capable of working for long periods inside a vehicle in fairly tough conditions (high ambient temperatures, rough road) that was both quick to install and to remove.
On previous tests a system from another supplier had turned out to be unreliable and had failed to cope with the harsh environment. The analysis processing had also proved tedious and time consuming due to the huge amount of data created when testing several vehicles over many days.
This video was sent to us by one of our customers. It shows how a Prosig P8000 was used to measure the vibration transmitted through different configurations of bicycle suspension.…
The V7.0 release of DATS, the long-established signal analysis software from Prosig, contains a comprehensive fatigue analysis package for stress-life, strain-life and weld-life prediction. Prosig also design and manufacture a…
The latest version of the CAN-bus/GPS (8440) module is now available for the Prosig P8012, P8020 and P8048 systems. The CAN-bus/GPS module has been in use in the field for some time now, recording CAN-bus information for display and analysis alongside noise, vibration, temperature and other signals captured by P8000 systems. The DATS software treats all analog and CAN-bus parameters in the same way so any mixture of parameters can be selected for display in real-time and subsequent processing. CAN-bus parameters can also be used to trigger immediate and pre-triggered captures and to stop captures.
The 8440 module now has an option to capture GPS parameters in addition to the other signals. The data capture software now also supports a realtime GPS track overlayed on a map. Velocity and altitude data measured by the GPS system can also be displayed alongside any other measurement channels in realtime displays. The latitude, longitude, altitude and velocity data is stored with with all the other sensor data captured by the P8000 system and is available to view and process in the resulting datasets. These signals can then be used to classify or select data for further analysis. For example you could choose to process data when the vehicle is on a particular road or a particular section of the track, or if you find an unusual event use the GPS data to give a position and time or the event.
 Prosig have welcomed 2010 with the official launch of their PROLOG data acquisition controller.
PROLOG is a controller that will allow remote, unattended or standalone operation of a P8000 system. In normal operation a P8000 data acquisition system is connected to a laptop or PC and data is stored, in real-time, on the computers hard drive via the USB 2.0 interface. This configuration provides a robust, high speed data capture environment. However, there are situations where it is not practical to keep the laptop connected. In some cases the environment may be suitable for the P8000 unit, but not for some of the more fragile components in a laptop. In other situations it may be desirable to have the measurement system in one location, whilst the operator may be positioned some distance away. The PROLOG unit is designed to address both of these requirements.

 Knowing how to measure torsional vibration is of key importance in the area of vehicle development and refinement. The main contributory source is the engine where periodically occurring combustion cycles cause variation in the crankshaft rotary vibration. This vibration is transmitted to and modified further by other components in the powertrain such as the gearbox and by other equipment driven off the drive belt or chain. Additional torsional vibrations are also likely to appear downstream at the drive shafts and wheels.
The size and shape of the Prosig P8000 data acquisition systems greatly facilitates installation in locations that are small or difficult to access. Now Prosig can offer a new level…

Using Prosig’s P8000 series data acquisition system with DATS signal analysis software, torsional analysis (crank shaft jitter) was performed on an automotive engine attached to an engine dynamometer. The significance of this is that only one tachometer channel was required to identify crank jitter.
(more…)
[Updated 4th October 2021]
In this post, we will discuss the different types of transducers that can be used with the Prosig data acquisition systems and loggers. The post looks at the design and function of the different types of sensors and the applications they are normally associated with.
(more…)
The following note describes measuring exhaust noise using a Prosig P8000/DATS system for the refinement of an automotive muffler design for a major after-market exhaust manufacturer in Europe. The particular vehicle under test was required by local legislation to have an overall radiated noise level of less than 70 dB. When tested, the vehicle was found to be producing 71.8 dB of radiated noise. The design of the exhaust system clearly needed to be reviewed and modified. (more…)

Accurate measurement of a signal depends on the dynamic range and the overall level of the data acquisition system. The overall level setting may be thought of as determining the largest signal that can be measured. This clearly depends on the present gain setting. That is the overall level is related to the gain. Clearly if the overall level is too small (gain too high) then the signal will be clipped and we will have poor quality data. The dynamic range then tells us that for the given overall level what is the smallest signal we can measure accurately whilst simultaneously measuring the large signal.
In a very simple sense suppose we have an artificial signal which consists of a sinewave at a large amplitude A for the first half and that this is followed by a sinewave with a small amplitude a for the second half. We will set the gain (the overall level) to allow the best measurement of the A sinewave. The dynamic range tells us how small a may be so we can also measure that without changing settings.
(more…)