How To Analyze Noise & Vibration In Rotating Machines

This article will look at the basic steps needed to measure noise & vibration in rotating machines. We won’t look in great detail at some of the techniques involved – we deal with these elsewhere on the blog. This material is suitable for a newcomer to the field who understands the basic concepts of noise & vibration analysis but has not dealt with rotating machinery before.

(more…)

Continue ReadingHow To Analyze Noise & Vibration In Rotating Machines

Exhaust Vibration Measurement – A Case Study

Exhaust Vibration Measurement - Customer Requirement One of Prosig's customers needed to perform exhaust vibration measurement on some of their vehicles. They contracted Prosig to take the measurements and provide reports of the…

Continue ReadingExhaust Vibration Measurement – A Case Study

Processing pump data – a classic case of amplitude modulation

When dealing with some vibration data from a pump, we observed some strange phenomena in the data. It turned out to be a classic case of amplitude modulation. Here we explain what that means.

Continue ReadingProcessing pump data – a classic case of amplitude modulation

Creating Order Plots Using The DATS Rotating Machinery Software

In this tutorial we will be creating order plots using waterfall and intensity displays using use the DATS.toolbox and Rotating Machinery Analysis option.

To begin, a noise, vibration or other signal of interest should be captured along with a tachometer signal.

In Figure 1 we have loaded a time series (in this case an acceleration signal) and a time series of a tachometer pulse train into the DATS software.

(more…)

Continue ReadingCreating Order Plots Using The DATS Rotating Machinery Software

What is waterfall frequency spacing? And how does the DATS parameter ‘Requested Frequency Spacing’ work?

Let us try to understand what waterfall frequency spacing is. Waterfall frequency spacing is the gap between spectral lines in an FFT plot.

For example, if you had an analysis frequency of 0Hz to 100Hz and 100 spectral lines, then Frequency Spacing is 1Hz.

So why is there a ‘Requested Frequency Spacing’ and an ‘Actual Frequency Spacing’? (more…)

Continue ReadingWhat is waterfall frequency spacing? And how does the DATS parameter ‘Requested Frequency Spacing’ work?

What is “waterfall smearing”?

When analysing a waterfall or performing order analysis it is important to consider the frequency resolution or the frequency spacing.

There is often a desire to increase the resolution to finer and finer detail. But that is a process of diminishing returns, and actually fraught with danger. And that danger is waterfall smearing. (more…)

Continue ReadingWhat is “waterfall smearing”?

How Do I Get An XYZ Resultant Waterfall

A user has three signals captured using a triaxial accelerometer and asked “What is the simplest way to get the XYZ resultant from run-up file?” He had tried forming a resultant of the raw time histories, but didn’t fully understand the resultant time history.

Of course, the correct way of processing the data is to calculate the individual waterfalls from the x, y & z data and then calculate a resultant waterfall. (more…)

Continue ReadingHow Do I Get An XYZ Resultant Waterfall

What is Synchronous (Angular) Sampling?

The term synchronous data is usually applied to vibration or acoustic data that is captured from an item of rotating equipment at regularly spaced angle intervals as distinct from regularly spaced time intervals. The rotating part could be an engine, a gear wheel, a drive shaft, a turbine rotor, a propeller, a turbocharger or any other type of rotary mechanical device. Typically these items are subjected to out-of-balance forces that cause them to vibrate at frequencies that are multiples of the fundamental (once per revolution) rotation speed frequency. (more…)

Continue ReadingWhat is Synchronous (Angular) Sampling?

How To Analyze & Measure Torsional Vibration

Torsional Vibration MeasurementKnowing how to measure torsional vibration is of key importance in the area of vehicle development and refinement. The main contributory source is the engine where periodically occurring combustion cycles cause variation in the crankshaft rotary vibration. This vibration is transmitted to and modified further by other components in the powertrain such as the gearbox and by other equipment driven off the drive belt or chain. Additional torsional vibrations are also likely to appear downstream at the drive shafts and wheels.

(more…)

Continue ReadingHow To Analyze & Measure Torsional Vibration

Orders v Time – Comparing Overall Levels

By combining a speed signal with a data signal and using the Short Time FFT algorithm (Hopping FFT), it is possible to extract order data directly as a function of time (Orders from Hopping FFT) rather than as a function of speed (Waterfall). This is very useful when analyzing a complete operational cycle which includes run ups, rundowns and periods at operational speeds.

(more…)

Continue ReadingOrders v Time – Comparing Overall Levels

Order Cuts And Overall Level

Order cuts are taken from a set of FFTs, each one at a different rpm. The rms level is then found as the Square root of the Sum of the squares of each of the FFT values. Mathematically, if x_{ks} is the modulus (magnitude) of the k^{th} value of the FFT at speed s for k = 1,\dots,N-1 then the rms value at that speed is given by

rms_s = \sqrt{\sum_{k=0}^{N-1}{x_{ks} ^2}}

This takes into account the entire energy at that speed both the order and the non order components, including any noise.

(more…)

Continue ReadingOrder Cuts And Overall Level

Measuring Exhaust Noise Using A P8000 System

The following note describes measuring exhaust noise using a Prosig P8000/DATS system for the refinement of an automotive muffler design for a major after-market exhaust manufacturer in Europe. The particular vehicle under test was required by local legislation to have an overall radiated noise level of less than 70 dB. When tested, the vehicle was found to be producing 71.8 dB of radiated noise. The design of the exhaust system clearly needed to be reviewed and modified. (more…)

Continue ReadingMeasuring Exhaust Noise Using A P8000 System

A Simple Automotive Noise Test

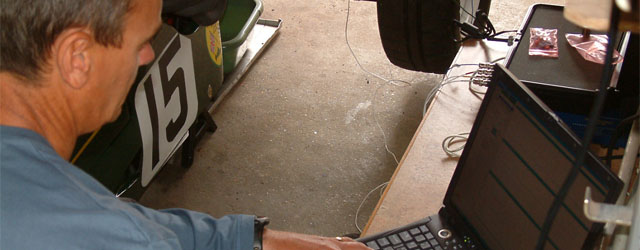
In a recent article we described how the Prosig P8000 hardware and DATS software had been used to help Dalmeny Racing diagnose a problem with an exhaust bracket on their Formula Ford racing car. Whilst the car was instrumented for structural tests on the exhaust the opportunity was taken to carry out a simple automotive noise test. It was felt that these would provide some useful “real world” data as well as maybe providing some extra information regarding the exhaust bracket failure. After analysing and animating the hammer data it became clear that the engine runup data wouldn’t be needed. However, it was decided that some analysis should be carried out to see if the noise and vibration data backed up the conclusions of the other tests.

(more…)

Continue ReadingA Simple Automotive Noise Test

High Pass Filtering And Tacho Signals

It is sometimes necessary to perform high pass filtering to eliminate low frequency signals. These may arise for instance from whole body vibrations when perhaps our interest is in higher frequency components from a substructure such as an engine or gearbox mounting. The vibration levels are speed sensitive and the usual scheme is to record a once per revolution ‘tacho’ signal with the vibration data. The tacho signal, which ideally is a nice regular pulse train, is processed to find rotational speed and hence to select which part of the vibration signal is to be frequency analyzed. The most common form of analysis is a waterfall type such as shown below.

(more…)

Continue ReadingHigh Pass Filtering And Tacho Signals